

Double Top (nearby pattern) and mBDSR (RCI two-filter) short signal (2)
0
New!!※On May 4, 2024An upgrade to the main indicators of 【mBDSR】has been implemented.
Not only arrow signs but also alerts can be triggered when the star sign lights up for the first time.
Additionally,4k monitor対応it has become possible to display arrows and stars even larger.
Please see the article below on Investment Navi+ for more details.
About the version upgrade of the main indicators of mBDSR
https://www.gogojungle.co.jp/finance/navi/articles/69373
GBPNZD 1-hour chart
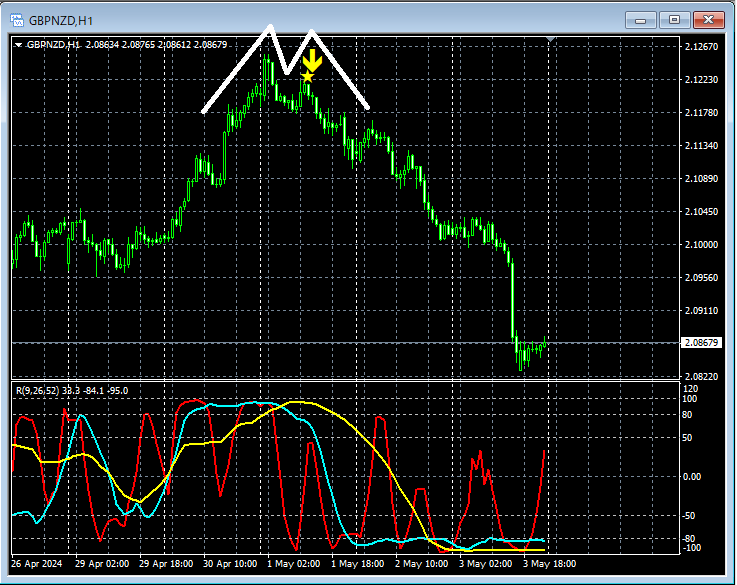
In the 1-hour chart above,the right-side valley of the double-top (or similar pattern)showsmBDSR (RCI with 2 lines) overbought signallighting up and price is dropping.
From this example,a trading method focusing on the double-topandthe signal of mBDSRdemonstrates high compatibility.
The indicator 【BODSOR・mBDSR】 that excels in combination with RCI
and its method & case studies (PDF) ★GogoJungle AWARD 2020 winner★
https://www.gogojungle.co.jp/tools/indicators/11836
The PDF file includes 301 items.
Many of them describe how to logically link higher and lower timeframes using three RCI lines to analyze multiple lower-timeframe scenarios sequentially, and ultimately wait for timing of pullbacks or buying dips on the lower timeframes (i.e., the mBDSR signal).
Additionally,many focus on identifying points where multiple entry criteria coincide..
In the explanations,over 1,000 chartsare used.

Not only arrow signs but also alerts can be triggered when the star sign lights up for the first time.
Additionally,4k monitor対応it has become possible to display arrows and stars even larger.
Please see the article below on Investment Navi+ for more details.
About the version upgrade of the main indicators of mBDSR
https://www.gogojungle.co.jp/finance/navi/articles/69373
GBPNZD 1-hour chart
In the 1-hour chart above,the right-side valley of the double-top (or similar pattern)showsmBDSR (RCI with 2 lines) overbought signallighting up and price is dropping.
From this example,a trading method focusing on the double-topandthe signal of mBDSRdemonstrates high compatibility.
The indicator 【BODSOR・mBDSR】 that excels in combination with RCI
and its method & case studies (PDF) ★GogoJungle AWARD 2020 winner★
https://www.gogojungle.co.jp/tools/indicators/11836
The PDF file includes 301 items.
Many of them describe how to logically link higher and lower timeframes using three RCI lines to analyze multiple lower-timeframe scenarios sequentially, and ultimately wait for timing of pullbacks or buying dips on the lower timeframes (i.e., the mBDSR signal).
Additionally,many focus on identifying points where multiple entry criteria coincide..
In the explanations,over 1,000 chartsare used.
× ![]()


