

Double top (or similar shape) and mBDSR (RCI 2-band filter) sell signal (1)
New!!※May 4, 2024Major upgrade of the key indicators for 【mBDSR】has been implemented.
Not only the arrow signs, but also the star signs light up with alerts on their first indication.
In addition,4K monitor optimizationallows the arrows and star signs to be displayed even larger.
For details, please read the article below in Investment Navi+.
Upgrade of the main indicators of 【mBDSR】
https://www.gogojungle.co.jp/finance/navi/articles/69373
EURNZD 30-minute chart
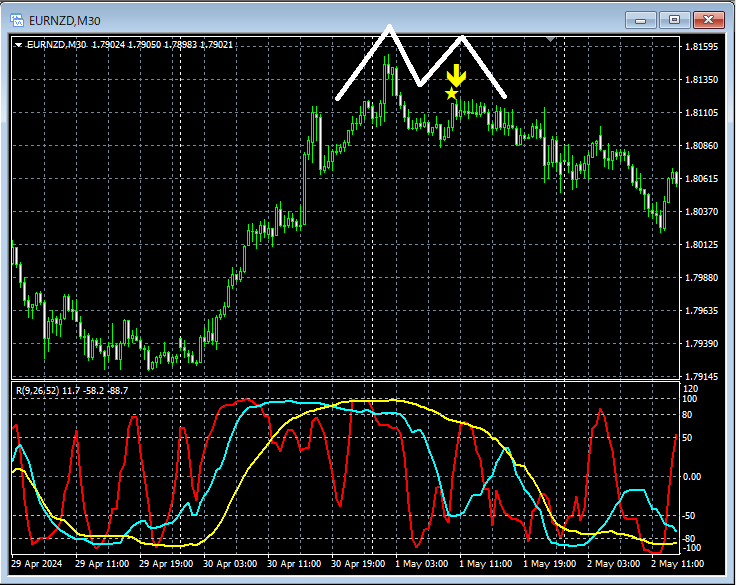
In the above 30-minute chart,the right-side trough of the double top (or a shape similar to it)showsthe mBDSR (RCI two-filter) pullback sell signallighting up and causing a decline.
From this example,a trading method focusing on the double topandthe compatibility with mBDSR signalsappear evident.
Indicators that are powerful in combination with RCI: 【BODSOR・mBDSR】
and their methods and case studies (PDF) ★GogoJungle AWARD 2020 winner★
https://www.gogojungle.co.jp/tools/indicators/11836
The PDF file includes 301 items.
Many of them are examples that logically link higher and lower timeframes using three RCI lines to examine multiple lower-timeframe conditions sequentially, ultimately waiting for pullbacks or buy the dips on the lower timeframes (i.e., the mBDSR signals).
Also,many of them emphasize identifying points where multiple entry signals coincide.
The explanation usesover 1,000 charts.

Not only the arrow signs, but also the star signs light up with alerts on their first indication.
In addition,4K monitor optimizationallows the arrows and star signs to be displayed even larger.
For details, please read the article below in Investment Navi+.
Upgrade of the main indicators of 【mBDSR】
https://www.gogojungle.co.jp/finance/navi/articles/69373
EURNZD 30-minute chart
In the above 30-minute chart,the right-side trough of the double top (or a shape similar to it)showsthe mBDSR (RCI two-filter) pullback sell signallighting up and causing a decline.
From this example,a trading method focusing on the double topandthe compatibility with mBDSR signalsappear evident.
Indicators that are powerful in combination with RCI: 【BODSOR・mBDSR】
and their methods and case studies (PDF) ★GogoJungle AWARD 2020 winner★
https://www.gogojungle.co.jp/tools/indicators/11836
The PDF file includes 301 items.
Many of them are examples that logically link higher and lower timeframes using three RCI lines to examine multiple lower-timeframe conditions sequentially, ultimately waiting for pullbacks or buy the dips on the lower timeframes (i.e., the mBDSR signals).
Also,many of them emphasize identifying points where multiple entry signals coincide.
The explanation usesover 1,000 charts.
× ![]()


