

Double Bottom (or similar shape) and mBDSR (RCI2 two-filter) Buy Signal
New!!※May 4, 2024Upgrade of the main indicators of 【mBDSR】has been performed.
Not only the arrow signs, but also alerts can be triggered at the first-time lighting of the star signs.
Also,4K monitor supportallows even larger display of arrows and star signs.
Please refer to the記事 below in Investment Navi+ for details.
About the version upgrade of the main indicators of mBDSR
https://www.gogojungle.co.jp/finance/navi/articles/69373
EURCAD 30-minute chart
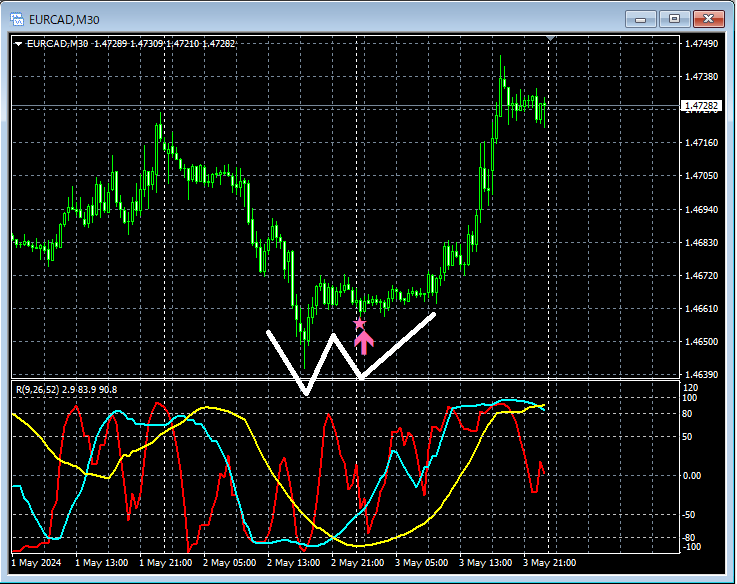
On the 30-minute chart above,the right-side valley of the double bottom (or a related shape)showsan mBDSR (RCI 2 lines filter) buy signallighting up and rising.
From this example,a trading method focusing on the double bottomandthe signal of mBDSRshow a strong synergy.
Indicators that excel in combination with RCI: 【BODSOR・mBDSR】
Methods and case studies (PDF) ★GogoJungle AWARD 2020 winner★
https://www.gogojungle.co.jp/tools/indicators/11836
The PDF file includes 301 items.
Most of them are compiled as examples that, using three RCI lines to logically link higher and lower timeframes, sequentially assess the conditions of multiple lower timeframes and ultimately wait for pullback buy or pullback sell timing (i.e., mBDSR signals) on the lower timeframe.
Additionally,many emphasize identifying points where multiple entry reasons coincide.
The explanations usemore than 1,000 charts.

Not only the arrow signs, but also alerts can be triggered at the first-time lighting of the star signs.
Also,4K monitor supportallows even larger display of arrows and star signs.
Please refer to the記事 below in Investment Navi+ for details.
About the version upgrade of the main indicators of mBDSR
https://www.gogojungle.co.jp/finance/navi/articles/69373
EURCAD 30-minute chart
On the 30-minute chart above,the right-side valley of the double bottom (or a related shape)showsan mBDSR (RCI 2 lines filter) buy signallighting up and rising.
From this example,a trading method focusing on the double bottomandthe signal of mBDSRshow a strong synergy.
Indicators that excel in combination with RCI: 【BODSOR・mBDSR】
Methods and case studies (PDF) ★GogoJungle AWARD 2020 winner★
https://www.gogojungle.co.jp/tools/indicators/11836
The PDF file includes 301 items.
Most of them are compiled as examples that, using three RCI lines to logically link higher and lower timeframes, sequentially assess the conditions of multiple lower timeframes and ultimately wait for pullback buy or pullback sell timing (i.e., mBDSR signals) on the lower timeframe.
Additionally,many emphasize identifying points where multiple entry reasons coincide.
The explanations usemore than 1,000 charts.
× ![]()


