

Dollar-yen: another double bottom formed on the right side of the double bottom, and a buying signal (pullback) from the mBDSR (RCI 2-band filter).
USD/JPY 5-minute chart
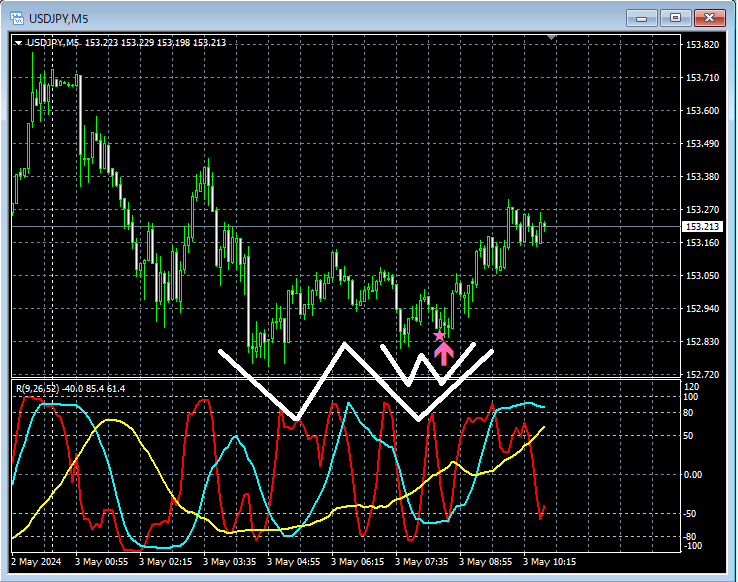
In the 5-minute chart above,the right-side valley of the double bottomformed anotherdouble bottomat its right-side valleymBDSR (RCI two-line filter) pullback buying signallights up and rises.
From this example,the trading method focused on the double bottomandthe signal of mBDSRshow a high degree of compatibility.
Indicators that unleash power in combination with RCI【BODSOR・mBDSR】
and the method & case studies (PDF) ★GogoJungle AWARD 2020 Winner★
https://www.gogojungle.co.jp/tools/indicators/11836
The PDF file includes 301 items.
Many of them compile examples where top and bottom timeframes are logically linked using three RCI lines to sequentially consider multiple lower-timeframe situations, ultimately waiting for pullback buying or retracement selling timing on the lower timeframe (i.e., the mBDSR signal).They also emphasize capturing points where multiple entry reasons overlap.
For explanation, more than 1,000 charts have been used in total.

× ![]()


