

Return sell signal of mBDSR (RCI2 double filter) before exchange intervention (?)
0
Indicator that shines when combined with RCI: 【BODSOR・mBDSR】
Methods & Case Studies (PDF) ★GogoJungle AWARD2020 Winner★
https://www.gogojungle.co.jp/tools/indicators/11836
※As of May 1, 2024, the total number of PDFs is 301 (Total pages: 1,000+; number of charts used in explanations: 1,000+).
AUD/JPY 1-minute chart

Zoom in on the area circled by the white ellipse in the above chart ↓
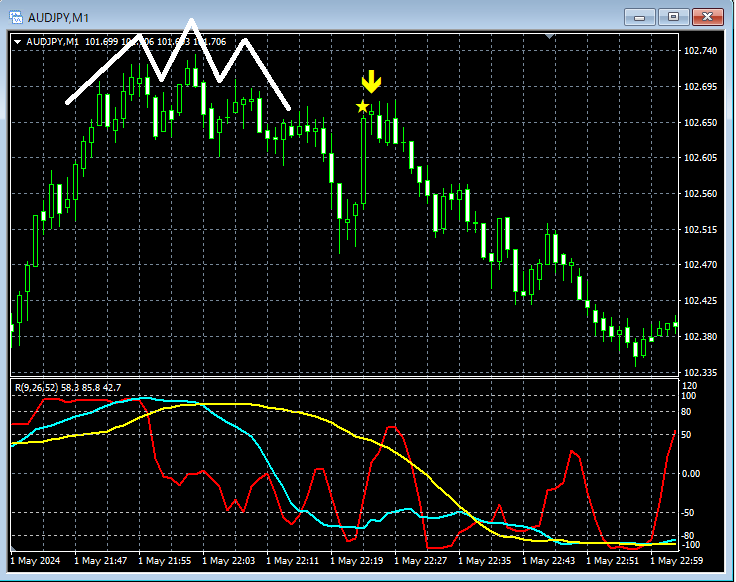
In the above 1-minute chart,Head and Shoulders forms and then risesmBDSR (RCI two-line filter) sell signal lights up and price declines. In this example, there is a rapid drop afterward.
From this example,a trading method focused on the Head and Shoulders andcompatibility with mBDSR signals can be seen to have a high level of coherence.
Indicator that shines when combined with RCI: 【BODSOR・mBDSR】
Methods & Case Studies (PDF) ★GogoJungle AWARD2020 Winner★
https://www.gogojungle.co.jp/tools/indicators/11836
The PDF files attached number 301.
Many of them are examples that lay out a method of sequentially examining multiple lower-timeframe conditions by logically linking higher and lower timeframes using three RCI lines, ultimately waiting for a Buy the dip or Sell the rally timing (i.e., mBDSR signals) on the lower timeframe.This is what they describe.
Additionally,many emphasize identifying points where multiple entry rationales overlap.There are many such examples.
In the explanations,over 1,000 charts are used.

× ![]()


