

【BODSOR・mBDSR】The total number of PDFs (methods and case studies) has reached 301.
0
GBPJPY 5-minute chart
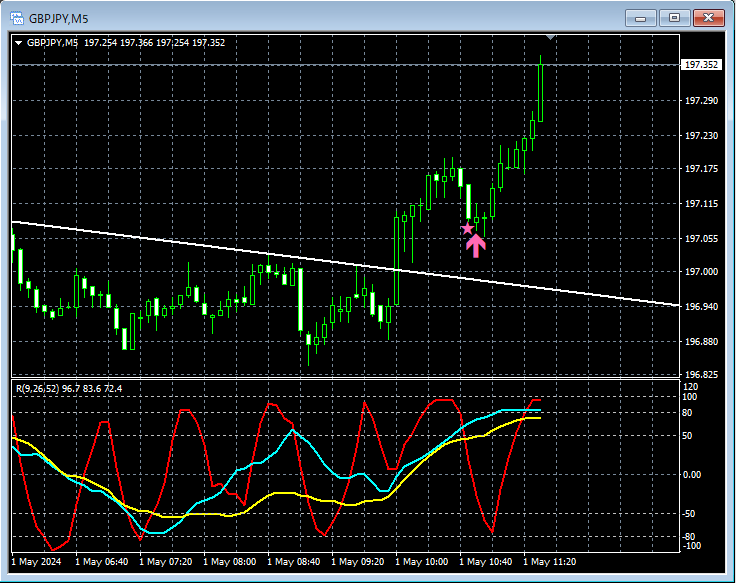
In the 5-minute chart aboveCountertrend lineafter breaking above, during the pullbackmBDSR (RCI two-line filter) buy signallights up and it’s rising.
From this example,a trading method focusing on the countertrend lineandthe signal of mBDSRshow a high level of compatibility.
Indicators that shine in combination with RCI: [BODSOR・mBDSR]
and Methodology / Case Studies (PDF) ★GogoJungle AWARD 2020 winner★
https://www.gogojungle.co.jp/tools/indicators/11836
The PDF file includes 301 items.
Many of them are examples that logically link higher and lower timeframes using three RCI lines, examining multiple lower-timeframe conditions sequentially, and ultimately waiting for pullbacks or pullback buy signals (i.e., mBDSR signals) on the lower timeframes.
Additionally,many focus on identifying points where multiple entry confirmations align.
The explanation usesover 1,000 charts.

× ![]()


