

RCI3 single line and double top and the sign of mBDSR and sharp decline
AUDJPY 15-minute chart
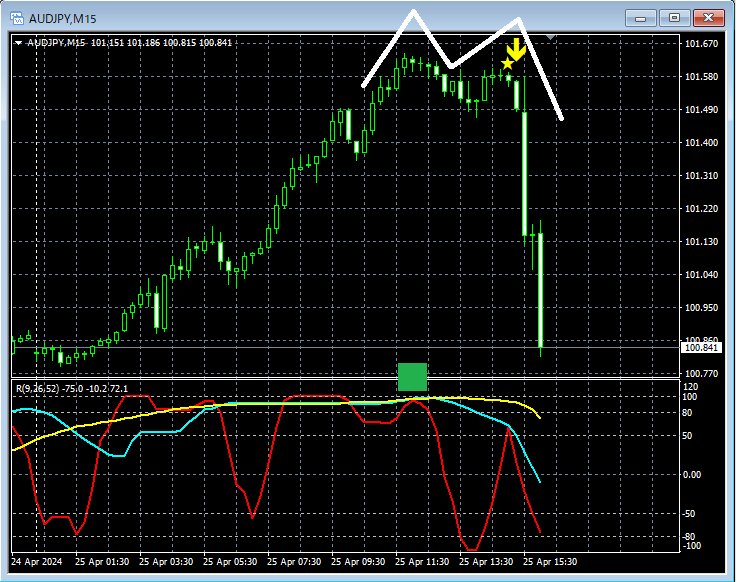
In the 15-minute chart above, it has risen to the so-calledRCI triple topshape, which becomes theleft peak (high) of the double top. After that,the right peak of the double toparoundmBDSR (RCI two-filters) sell-back signallights up and it declines (plunges).
From this example,a trading method that focuses on the RCI three-line and the double topandthe signal of mBDSRshows high compatibility.
Indicator that demonstrates power when combined with RCI【BODSOR・mBDSR】
and methods & case studies (PDF) ★GogoJungle AWARD2020 winner★
https://www.gogojungle.co.jp/tools/indicators/11836
The PDF file includes 286 items.
Many of them summarize examples where, by using the three-line RCI to logically link higher and lower timeframes, multiple lower-timeframe situations are examined in order, ultimately waiting for the timing of a buying dip or selling rally on the lower timeframes (i.e., the mBDSR signal).
Also,many of them focus on identifying points where multiple entry reasons overlap.There are.
In the explanations,more than 1,000 chartsare used.

× ![]()


