

Three reverence and RCi 3-line and mBDSR (RCI 2-filter) short selling signal
0
USDCAD 4-Hour Chart
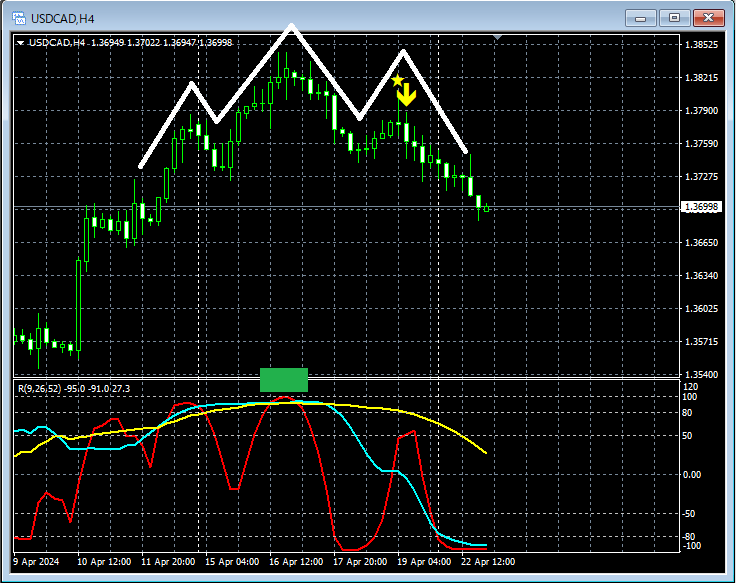
In the 4-hour chart above, the so-calledRCI 3-Fold Tophas risen to a pattern that forms theHead and Shoulders Highvalue. After that,Right Shoulder of the Head and Shouldersaround that areamBDSR (Two RCI lines filter) Buyback Signallights up and it declines.
From this example,the high compatibility between trades focusing on RCI three-line patterns and head-and-shoulders, andthe signals of mBDSRis evident.
Indicators that show power when combined with RCI: 【BODSOR・mBDSR】
and their methods & case studies (PDF) ★GogoJungle AWARD 2020 Winner★
https://www.gogojungle.co.jp/tools/indicators/11836
The PDF file comes with 286 items.
Many of thesesummarize examples that link higher and lower timeframes logically using the RCI three-line pattern, examining the situation across multiple lower timeframes sequentially, and ultimately waiting for pullback buying or pullback selling timing (i.e., mBDSR signals) on the lower timeframe.
Also,there are many that focus on identifying points where multiple entry reasons overlap.
Explanation usesmore than 1,000 charts in total.

× ![]()


