

USD/JPY double top and mBDSR (RCI 2-filter) pullback sell signal
0
USD/JPY Four-hour chart
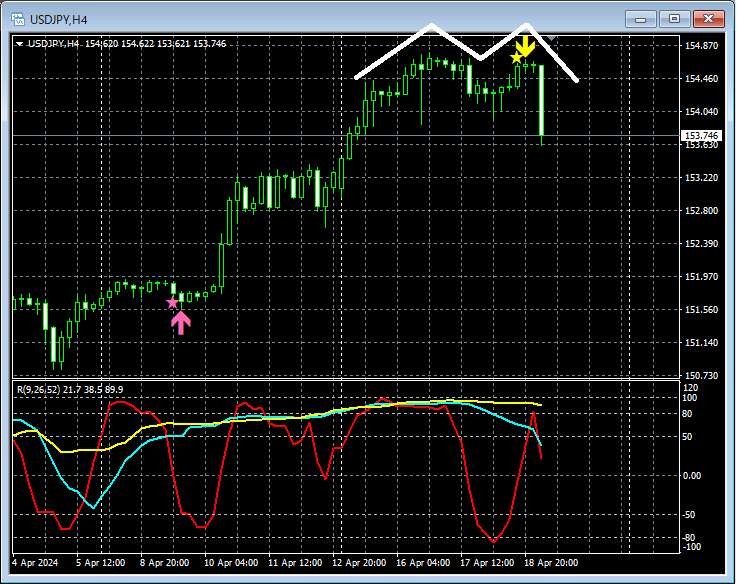
On the four-hour chart above,the right peak of the double topisthe mBDSR (RCI two-filter) overbought/sell signallighting up and descending.
From this example,the trading method focusing on the double topandthe signal of mBDSRshow a high degree of compatibility.
Indicators that shine in combination with RCI — [BODSOR・mBDSR]
and Method/Case Studies (PDF) ★GogoJungle AWARD2020 winner★
https://www.gogojungle.co.jp/tools/indicators/11836
The PDF file includes 285 items.
Many of themsummarize examples that logically link upper and lower timeframes using three RCI lines, sequentially analyze the conditions of multiple lower timeframes, and ultimately wait for the timing to buy on dips or sell on retracements in the lower timeframe (i.e., the mBDSR signal)as their form.
Additionally,many emphasize capturing points where multiple entry reasons convergeas well.
The explanations usemore than 1,000 charts in total..

× ![]()


