

New Zealand Yen 15-minute chart aiming for the 3rd wave!!
0
New Zealand Yen 15-minute chart
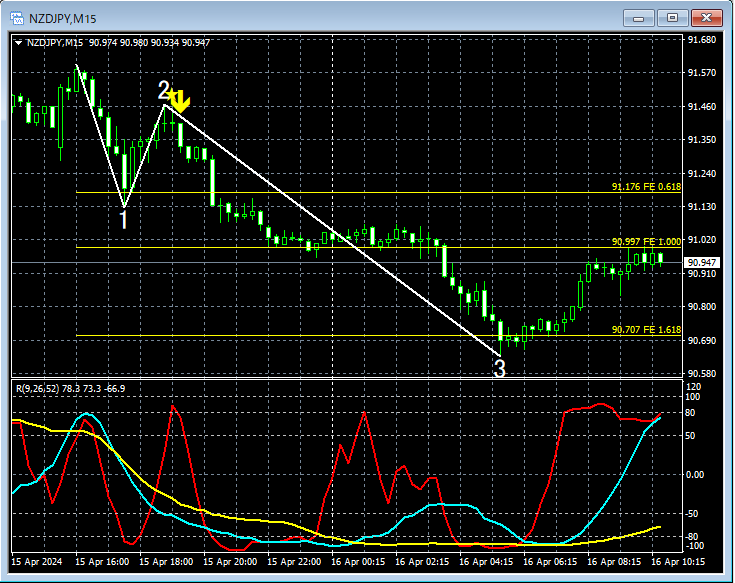
In the 5-minute chart above,the initial move of Wave 3isthe mBDSR (RCI two-line filter) overbought/sell signallights up and it is descending.
From this example,a trading method targeting Wave 3andthe signal of mBDSRshow high compatibility.
Indicators that shine in combination with RCI【BODSOR ・ mBDSR】
and technique / case study (PDF) ★GogoJungle AWARD 2020 winner★
https://www.gogojungle.co.jp/tools/indicators/11836
The PDF file includes 285 files.
Many of them summarize examples that logically link higher and lower timeframes using three RCI lines to examine multiple lower-timeframe conditions sequentially, ultimately waiting for timing to buy on dips or sell on rallies in the lower timeframes (i.e., the mBDSR signal)..
Also,many focus on capturing points where multiple entry rationale converge..
The explanation usesmore than 1,000 charts..

× ![]()


