

Double top and mBDSR (RCI2 dual-filter) selling signal
0
AUDCAD 4-hour chart
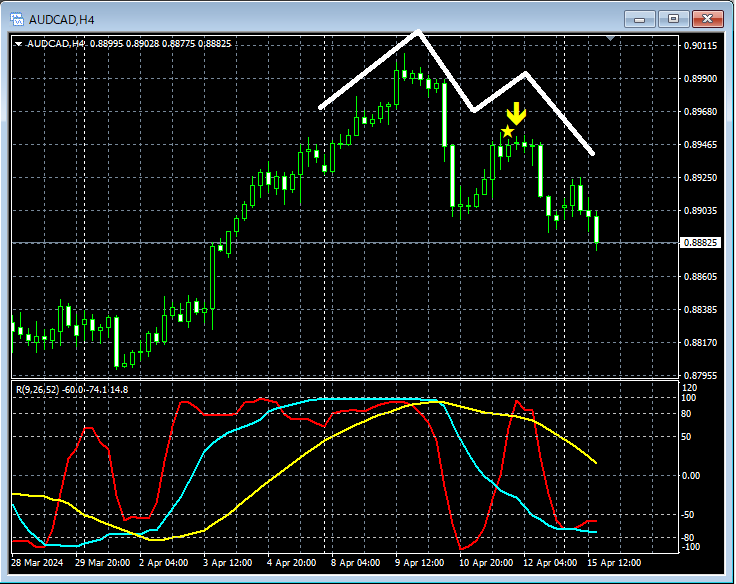
In the 4-hour chart above,the right shoulder of the double topisthe mBDSR (RCI 2-line filter) sell signal on the pullbacklights up and it is moving down.
From this example,the trading method focused on the double topandthe compatibility with mBDSR signalsare evident.
Indicator that shines in combination with RCI: 【BODSOR・mBDSR】
and the method/case studies (PDF) ★GogoJungle AWARD2020 winner★
https://www.gogojungle.co.jp/tools/indicators/11836
The PDF file includes 284 items.
Many of these are summaries of examples that logically link multiple higher-timeframe and lower-timeframe using three RCI lines, and ultimately approach lower timeframes for pullback buying or pullback selling timings (= mBDSR signals).
Also,many focus on capturing points where multiple entry reasons coincide..
In the explanations,more than 1,000 chartshave been used.

× ![]()


