

Dow Theory, Fibonacci Retracement, and mBDSR (RCI with two filters) Signals
0
Indicator【BODSOR・mBDSR】 that demonstrates power when combined with RCI
Methods and case studies (PDF) ★GogoJungle AWARD2020 winner★
https://www.gogojungle.co.jp/tools/indicators/11836
PDF files on methods and case studies have been expanded further, and as of April 15, 2024, the total number is 285. In terms of pages, it exceeds a total of 1,000 pages
Pound/OTC JPY 4-hour chart
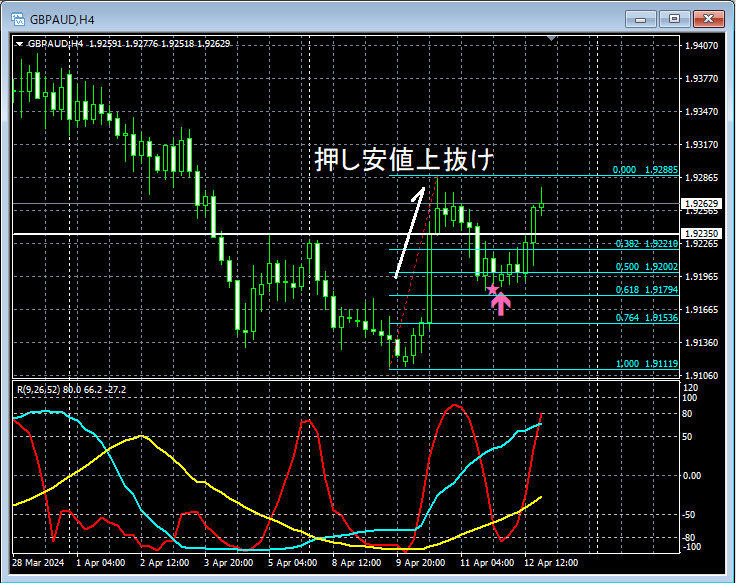
On the 4-hour chart above,rebounce highis broken above,Fibonacci retracement 61.8%falls to nearmBDSR (RCI two-filter) pullback buy signallights up and rises.
From this example,a trading method focused on Dow Theory and Fibonacci retracementandthe signal of mBDSRshow strong compatibility.
Indicator【BODSOR・mBDSR】that combines powerful with RCI
Methods and case studies (PDF) ★GogoJungle AWARD2020 winner★
https://www.gogojungle.co.jp/tools/indicators/11836
PDF files are attached in 285 copies.
Most of them are examples that have been distilled to wait for pullbacks or pullback sell timing on the lower time frames by logically linking higher and lower timeframes using three RCI lines (RCI3-line) and considering the situations of multiple lower timeframes, ultimately waiting for the mBDSR signal on the lower timeframe.
Also,many focus on capturing points where multiple entry reasons coincide.
Explanation usesmore than 1,000 charts.

× ![]()


