

USD/JPY 1-minute chart, notable past lows and mBDSR (RCI 2-line filter) selling signal
USD/JPY 1-minute chart
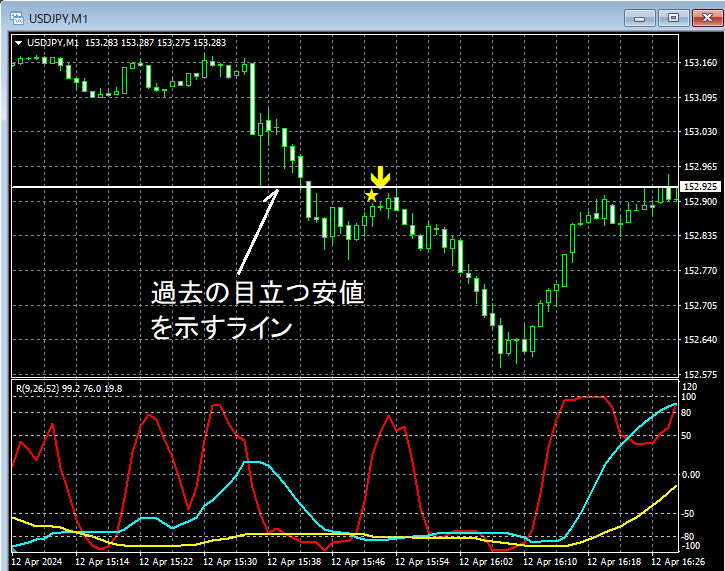
In the 1-minute chart above,a line indicating notable past lowshas risen close tothe mBDSR (two RCI filters) overbought signallights up and it’s moving down.
From this example,a trading method focused on notable past lowsandthe signals of mBDSRshow a high degree of harmony.
Indicator that shines when combined with RCI: [BODSOR・mBDSR]
and strategies & case studies (PDF) ★GogoJungle AWARD2020 winner★
https://www.gogojungle.co.jp/tools/indicators/11836
The PDF file includes 284 items.
Many of them describe how to logically link higher and lower timeframes using three RCI lines, examining multiple lower-timeframe conditions step by step, and ultimately waiting for timing to buy on dips or sell on rallies in the lower timeframe (i.e., the mBDSR signals).
Additionally,many are focused on capturing points where multiple entry reasons converge..
The explanations useover 1,000 charts in total.

× ![]()


