

Regisapo Conversion and mBDSR (RCI2 Two-Filter) Rebound Sell Signal
AUDUSD 4-hour chart
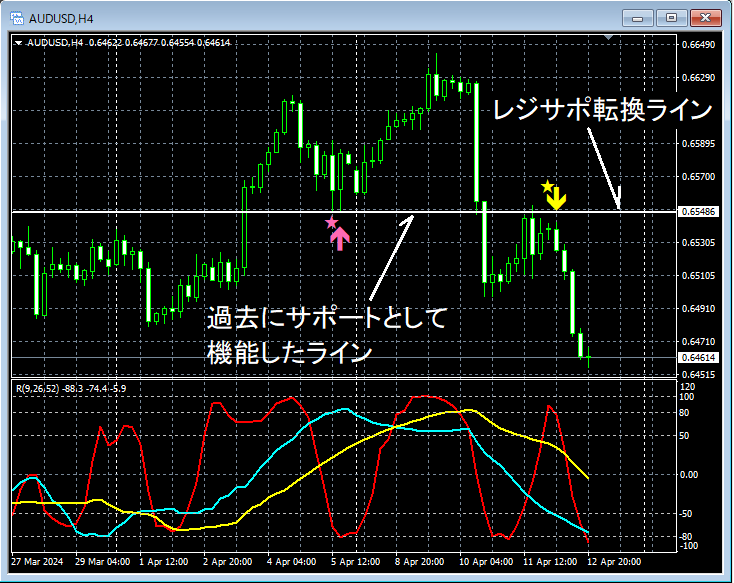
In the 4-hour chart above,the line that has historically acted as supporthas risen toward the vicinity,mBDSR (RCI two-filter) the returning sell signallights up and prices are turning down.
From this example,a trading method focusing on support/resistance turning pointsandthe signal of mBDSRshow a strong compatibility.
Indicator that shines when used in combination with RCI【BODSOR・mBDSR】
and methodology / case studies (PDF) ★GogoJungle AWARD 2020 winner★
https://www.gogojungle.co.jp/tools/indicators/11836
The PDF file includes 284 items.
Many of these demonstrate a method of logically linking higher and lower timeframes using three RCI lines to consider multiple lower timeframes sequentially, ultimately waiting for timing signals for buying on dips or selling on rallies in the lower timeframe (i.e., the mBDSR signal).
Additionally,many focus on identifying points where multiple entry reasons coincide..
The explanations useover 1,000 charts..

× ![]()


