

Gold XAUUSD April 10, 2024
Gold XAUUSD 5-minute chart
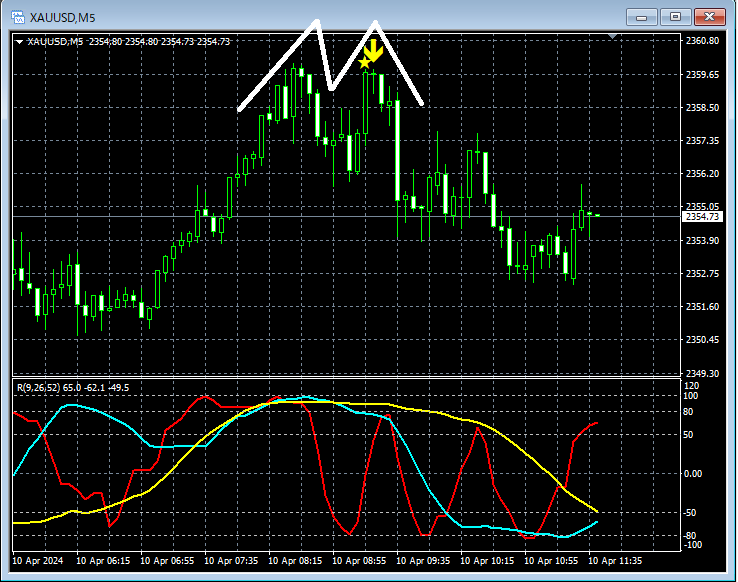
In the 5-minute chart above,Double Topon the right peakmBDSR (RCI two-filter) sell signallights up and it declines.
From this example,a trading method focused on the double topandthe signal of mBDSRshow a strong compatibility.
Indicators that are powerful in combination with RCI【BODSOR・mBDSR】
and the method / case study (PDF) ★GogoJungle AWARD2020 winner★
https://www.gogojungle.co.jp/tools/indicators/11836
The PDF file comes with 284 items.
Many of them summarize examples that break down situations across multiple lower timeframes by logically linking the higher and lower timeframes using three RCI lines, ultimately waiting for pullback buying or pullback selling timing (i.e., the mBDSR signal) on the lower timeframe.
Also,many focus on capturing points where multiple entry reasons overlap..
The explanations useover 1,000 charts in total..

× ![]()


