

Dollar-Yen double bottom, Fibonacci retracement, and mBDSR (RCI two-line filter) pullback buying signal
USD/JPY 15-minute chart
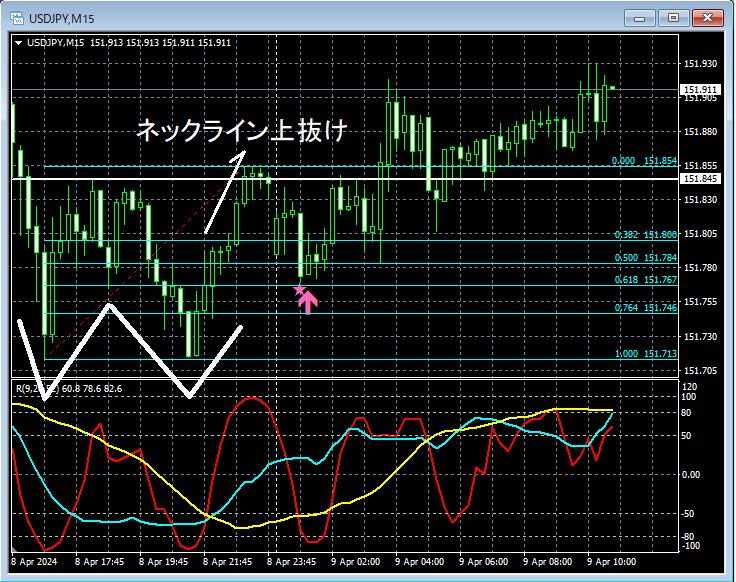
On the 15-minute chart above,the neckline of the double bottomis temporarily broken upward,Fibonacci retracement 61.8% pullbackaround that areamBDSR (RCI two-filter) pullback buying signallights up and it rises.
From this example,a trading method that focuses on double bottoms and Fibonacci retracementsandthe signals of mBDSRshow high compatibility.
Indicators that are powerful in combination with RCI: [BODSOR・mBDSR]
and method & case studies (PDF) ★GogoJungle AWARD 2020 winner★
https://www.gogojungle.co.jp/tools/indicators/11836
The PDF file is attached with 284 items.
Many of them are examples that logically link higher and lower time frames by using three RCI lines, examining the conditions of multiple lower time frames step by step, and ultimately waiting for pullbacks in the lower time frame (i.e., mBDSR signals) for timing of buy on dips or sell on rallies.They also include many that emphasize finding points where multiple entry rationales overlap.
In the explanations,
more than 1,000 chartsare used.

× ![]()


