

Pound/Yen Moving Average, Double Bottom, and mBDSR (RCI two-line filter) Bullish Signal
Pound-Yen 1-Hour
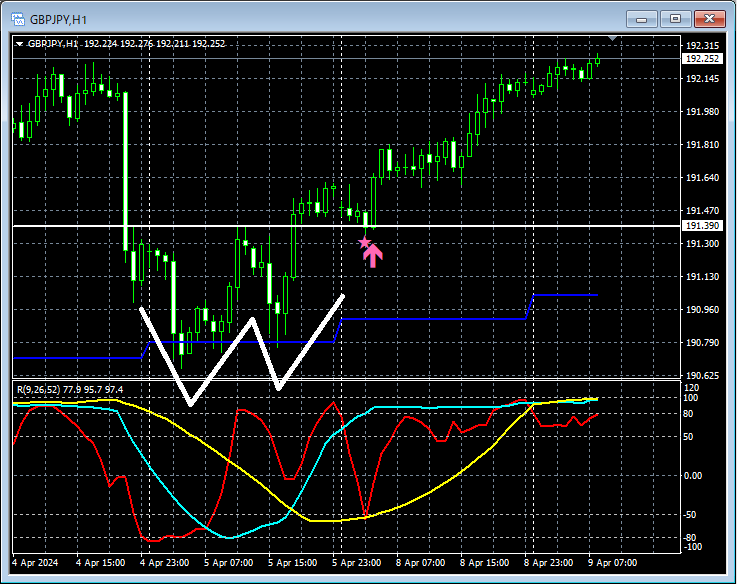
In the 1-hour chart above,Daily EMA21around whichDouble Bottomis formed and rises,Double Bottom Necklineapproaches,mBDSR (RCI two-filter) Pullback Buy signallights up and it rises.
From this example,a trading method focused on moving averages and double bottomsandthe signal of mBDSRshow strong harmony.
Indicators【BODSOR・mBDSR】that excel in combination with RCI
and Method/Case Studies (PDF) ★GogoJungle AWARD2020 winner★
https://www.gogojungle.co.jp/tools/indicators/11836
The PDF file consists of 283 items.
Many of themsummarize cases where the upper and lower timeframes are logically linked using three RCI lines to sequentially examine the status of multiple lower timeframes, ultimately waiting for pullbacks or pullbacks timing (i.e., mBDSR signals) on the lower timeframe.
Also,many focus on identifying points where multiple entry reasons converge.
The explanation usesmore than 1,000 charts.

× ![]()


