

Dollar/Yen 1-minute chart April 9, 2024
USD/JPY 1-minute chart
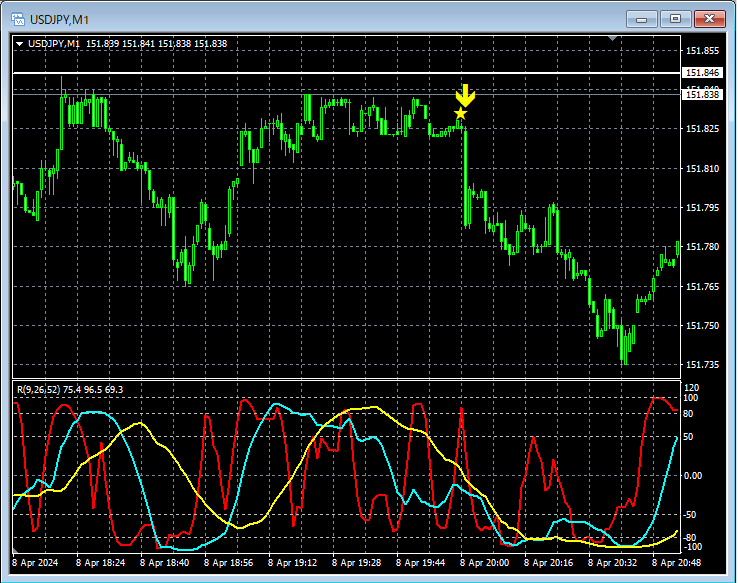
In the 1-minute chart above,Resistance-turned-support linereached near,mBDSR (RCI two-filter) overbought/over-sold signallights up and it declines.
From this example,a trading method focusing on the resistance-turned-support lineandthe signals of mBDSRshow strong compatibility.
An indicator that excels in combination with RCI: [BODSOR・mBDSR]
Methods & Case Studies (PDF) ★GogoJungle AWARD2020 winner★
https://www.gogojungle.co.jp/tools/indicators/11836
The PDF file includes 283 items.
Many of themare examples that detail using three RCI lines to logically link higher and lower timeframes, sequentially considering multiple lower timeframes, and ultimately waiting for pullbacks or pullback entries on the lower timeframes (i.e., mBDSR signals)..
Additionally,there are many that emphasize capturing points where multiple entry reasons coincide..
In the explanations,over 1,000 chartsare used.

× ![]()


