

Dollar/Yen 1-minute chart April 8, 2024
USD/JPY 1-minute chart
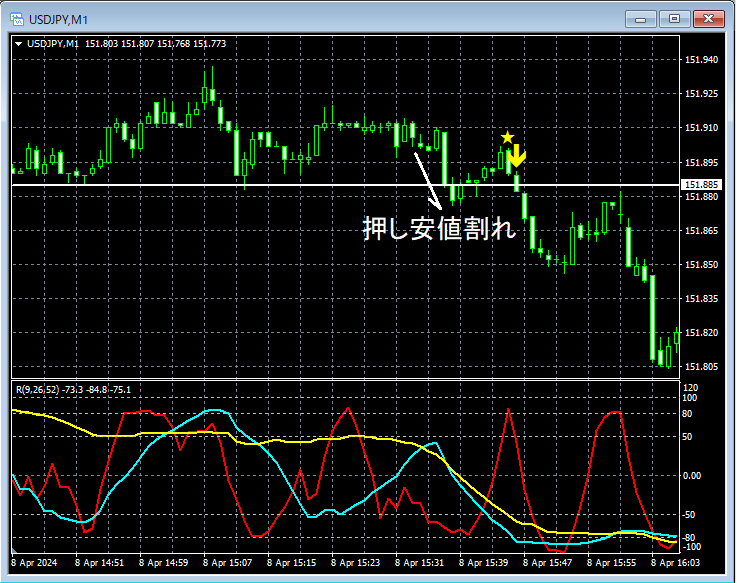
In the 1-minute chart above,the breakout below the swing lowis followed by a rise,the mBDSR (RCI two-line filter) rebound sell signallights up and trends downward.
From this example,a trading method focusing on the swing low (Dow Theory)andthe signal of mBDSRshow a high level of compatibility.
Indicator that shines in combination with RCI: [BODSOR・mBDSR]
and method & case studies (PDF) ★GogoJungle AWARD 2020 Winner★
https://www.gogojungle.co.jp/tools/indicators/11836
The PDF file comes with 283 items.
Most of them explain multiple lower-timeframe scenarios by logically linking higher and lower timeframes using three RCI lines, ultimately detailing a form that waits for pullback buying on the lower timeframe or selling on rebounds (i.e., the mBDSR signal).It is summarized as examples.
Also,many emphasize identifying points where multiple entry reasons overlap..
Explanation usesover 1,000 charts.

× ![]()


