

US employment statistics and USD/JPY
0
USD/JPY 30-minute chart
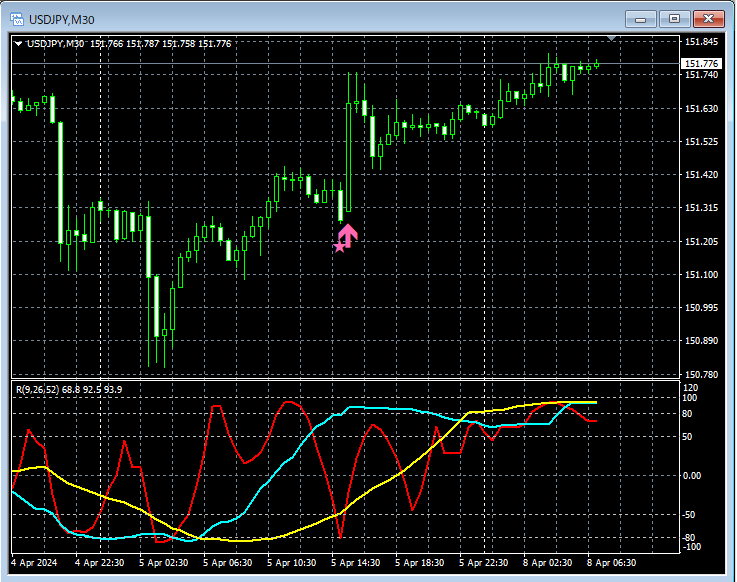
On the 30-minute chart above,U.S. Nonfarm Payrollsare rising sharply upon their release. Just before the increase started,mBDSR (2-line RCI pullback buy signal)has lit up.
An indicator that shines when combined with RCI【BODSOR・mBDSR】
and methodology / case studies (PDF) ★GogoJungle AWARD 2020 winner★
https://www.gogojungle.co.jp/tools/indicators/11836
A PDF file with 283 items is included.
Most of them are summaries of examples that break down how to logically link higher and lower timeframes using three RCI lines, sequentially considering the conditions of multiple lower timeframes, and ultimately waiting for pullback buys or pullback sells on the lower timeframe (i.e., the mBDSR signal).
Additionally,many emphasize capturing points where multiple entry reasons overlap.There are many.
In the explanations,more than 1,000 chartsare used.

× ![]()


