

An indicator that shines in combination with RCI: 【BODSOR・mBDSR】★GogoJungle AWARD2020 Winner★
【Mastering RCI!!】
An indicator that shines when combined with RCI: BODSOR・mBDSR
and method・case study (PDF) ★GogoJungle AWARD2020 winner★
https://www.gogojungle.co.jp/tools/indicators/11836
This page is a more detailed explanation of the above product. A more detailed description is provided on the product sales page, so when considering a purchase, please be sure to read this page.
=================
★GogoJungle AWARD2020 Indicator・E-book Division Winner★

※This product consists of the MT4 indicators 【mBDSR】 and 【R1R2S2】 and a collection of 358 PDF files focusing on the method・case studies. The PDFs include explanations using more than 1,350 charts (over 1,400 pages in total).
PDF page structure is such that, in most cases, the top half contains one chart and the bottom half contains textual descriptions.
※【BODSOR・mBDSR】 are unpainted indicators. They include alert functionality and push notifications.
◆Introduction (RCImBDSR Market Reversal Theory・Others)
※What is the “RCImBDSR Market Reversal Theory”?
● A theory that fuses “the theory derived from the characteristics of RCI” with “the theory based on experience in the development of mBDSR.”
● By using the combination of “Logical multi-time-frame analysis using 3 RCI lines” and “mBDSR (indicator) developed from price action study” to capture timing for rises from pullbacks, declines from pullbacks, and trend reversals, etc.
● First, primarily through logical multi-time-frame analysis using the 3-line RCI and cascading from higher timeframes to lower timeframes to wait for signals from the mBDSR indicator. In the final stage, entry timing is determined by the entry timing signal from the mBDSR indicator. In the final stage, it is also possible to time entries using the later-added R1R2S2 (indicator).
● Detailed explanations across 358 PDF files (over 1,400 pages).
● Each PDF stands alone in its content.
● Also uses the “Fractal Structure Theory.”
※The RCImBDSR Market Reversal Theory is ...
● Allows credible entries based on three RCI lines.
● You can study the application of RCI.
● You can expand your repertoire of trading methods using RCI.
● It supports position trades, swing trades, day trades, and even scalping.
● Also highly compatible with various theories.
● It helps detect patterns like double tops/bottoms, head-and-shoulders, and inverse head-and-shoulders.
● It also helps identify pullbacks from support/resistance considerations involving trendlines, moving averages, swing lows, swing highs, past notable highs/lows, Fibonacci levels, and key round numbers for pullbacks from pullbacks or rises from pullbacks.
● It is helpful for pullbacks after breaking above/below support/resistance levels (supply-demand reversals).
● It also helps time rises from pullbacks during sharp surges (and declines).
● It harmonizes well with Dow Theory and Elliott Wave theory.
● It also harmonizes well with moving averages and GMMA.
Video September 15, 2022 (Re-upload)

“Buying on pullbacks and selling on rallies with RCI 3-lines + mBDSR” – Basic Concept –
Video September 15, 2022 (Re-upload)

⇒ Investment Navigator+ article“◆RCI and mBDSR and various chart patterns”
https://www.gogojungle.co.jp/finance/navi/articles/41539
Video September 15, 2022 (Re-upload)

⇒ Investment Navigator+ article“RCI 3-line and Double Tops/Double Bottoms and mBDSR signals”
https://www.gogojungle.co.jp/finance/navi/articles/46283
News
The titles and outlines of the 358 accompanying PDFs are summarized in the article below on Investment Navigator+.
【BODSOR・mBDSR】 358 accompanying PDF files
https://www.gogojungle.co.jp/finance/navi/articles/34271
The previousversion historyandPDF additionsare summarized here in the Investment Navigator+ article.
Note: [mBDSR] includes an indicator called [mBDSRplus] (sold separately) developed to capture pullbacks and pullbacks that the standard mBDSR cannot.
【mBDSRplus】An indicator that shines when combined with RCI and moving averages (sold separately)
https://www.gogojungle.co.jp/tools/indicators/18191
◆Table of contents
Introduction (RCImBDSR Market Reversal Theory・Others)
Table of contents(Current location)
Development history of mBDSR
Examples of signals in mBDSR (RCI 2-lines as filter)
Examples of signals in mBDSR (MA 2-lines as filter)
Use of mBDSR with RCI2 filter together
Example charts displaying mBDSR (MA filter) together with GMMA
Effective use of mBDSR signals (core of “RCImBDSR Market Reversal Theory”)
Important version updates and recent updates
Features of mBDSR’s signal display
mBDSR settings (about the filter-less 【mBDSR_VAP】)
Details on the RCI filter version of mBDSR
Details on the moving average filter version of mBDSR
Details on R1R2S2
mBDSR (RCI 2-line filter) validated with EA
Notes (mBDSR)
“RCI 3-line + mBDSR (no filter)” signal examples
Signal-based trend reversal examples from the “RCI 3-line + mBDSR (no filter)”
“mBDSR (RCI 2-line filter)” signals with trend reversals and double bottoms/double tops
“mBDSR (RCI 2-line filter)” signals with trend reversals and head-and-shoulders
“mBDSR (RCI 2-line filter)” signals and necklines of head-and-shoulders
Rebound from rising trendline and signal from mBDSDR (RCI 2-line filter)
EMA and past notable lows and double tops and mBDSDR (RCI 2-line filter) signals
Signals of mBDSR and counter-trend lines and pullback highs and Fibonacci retracement
Drops, pullback highs, mBDSR signals and Fibonacci retracements
Pullback highs (Dow Theory) and mBDSR signals
Elliott Wave and mBDSR (RCI 2-line filter) signals
PDF-1: Hints for leveraging “RCI3-line + mBDSR” in trading
PDF-2 – 4: Hints for leveraging “RCI3-line + mBDSR” in trading-2 – 4
PDF-5 – 9: About
PDF-10 – 20: About
PDF-21 – 30: About
PDF-31 – 358: About
About BODSOR
Others (Investment Navigator+, Blacksun indicators list)
Back to contents
◆mBDSR Development History
“Buying on pullbacks and Selling on rallies with mBDSR”
One characteristic of RCI3-line (RCI9, RCI26, RCI52) is“When all three RCIs point in the same direction, price movement in that direction tends to be larger.”There are cases where this happens.
If RCI26 and RCI52 are rising (falling) while RCI9 is falling (rising), and RCI9 reverses,“All three RCIs align in the same direction”Thusit is extremely important to sense when RCI9 will reverse.This is crucial.
Therefore, to minimize delays in such situations, price action-based signals were used to detect reversal signs of RCI9 as early as possible, leading to the development of 【BODSOR】.
【mBDSR】 was developed with a similar concept to【BODSOR】. However, the arrow signal generation conditions and calculation methods are completely different from 【BODSOR】.
【mBDSR】 provides more arrow signals than 【BODSOR】, increasing the likelihood of capturing entry opportunities that were unattainable with BODSOR.
※ As described above, both 【BODSOR】 and【mBDSR】 are designed to quickly detect reversal signs of RCI9 based on price action. Therefore, when either BODSOR or mBDSR shows an up arrow (or down arrow), it does not guarantee price will move accordingly.
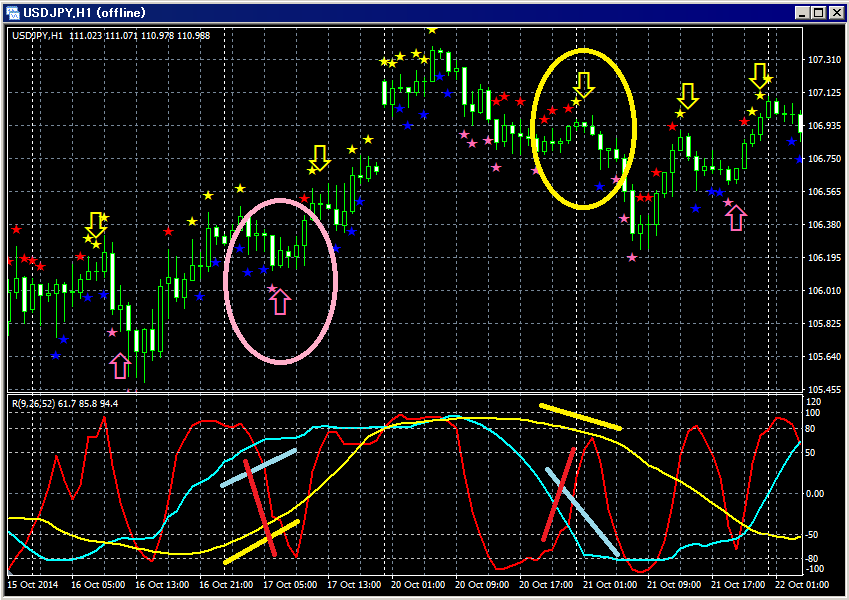
Version without filters
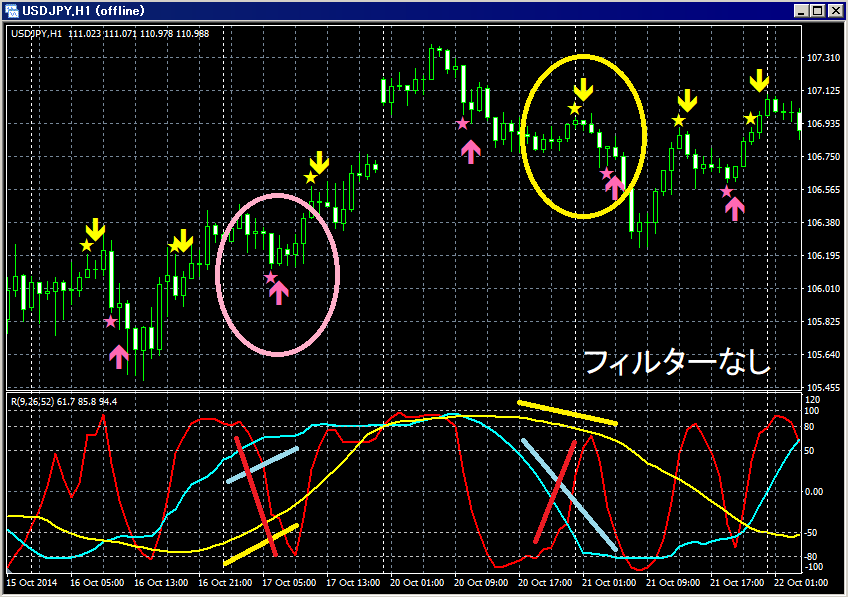
Main window:mBDSR (no filter)
Sub window: RCI3-line (RCI9,26,52)
※This indicator (mBDSR) includes an indicator that displays the three RCIs.
※However, to display mBDSR, you do not need to install the indicator that displays the three RCIs.
※Therefore, if you already display RCIs to your preference or don’t need to display RCIs, there is no need to install the included RCIs display indicator to show mBDSR.
Pullback buying:
When the pink star appears, at the next candle's open, thepink arrowis displayed.
On the chart above, the pink oval highlights a case where only RCI9 was clearly declining among the three RCIs, and the mBDSR pullback-buy signal lit up and functioned well.(In this example, the mBDSR signal lights four candles before the candle where RCI9 reverses.)
Pulldown selling:
When the yellow star appears, at the next candle's open, theyellow arrowis displayed.
On the chart above, the yellow oval highlights a case where only RCI9 was rising among the RCIs, and the mBDSR pullback-selling signal lit up and worked well.(In this example, the mBDSR signal lights four candles before the candle where RCI9 reverses.)
mBDSR version filtered by 2 RCIs
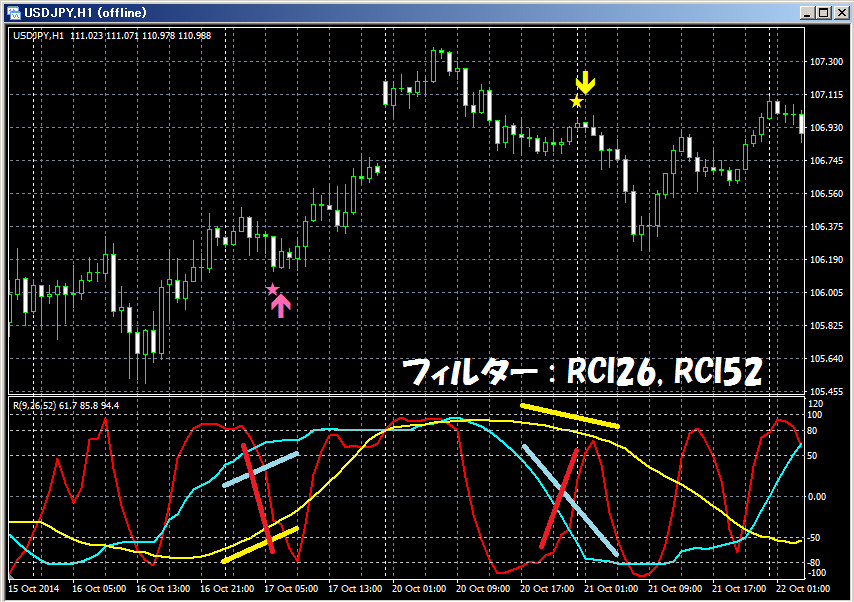
Main window:mBDSR (Filter: RCI26, RCI52)
Sub window: RCI3-line (RCI9,26,52)
※This indicator (mBDSR) includes an indicator that displays the three RCIs.
※However, to display mBDSR, you do not need to install the indicator that displays the three RCIs.
※Therefore, if you already display RCIs or do not need to display RCIs, there is no need to install the included three-RCI indicator to display mBDSR.
Back to contents
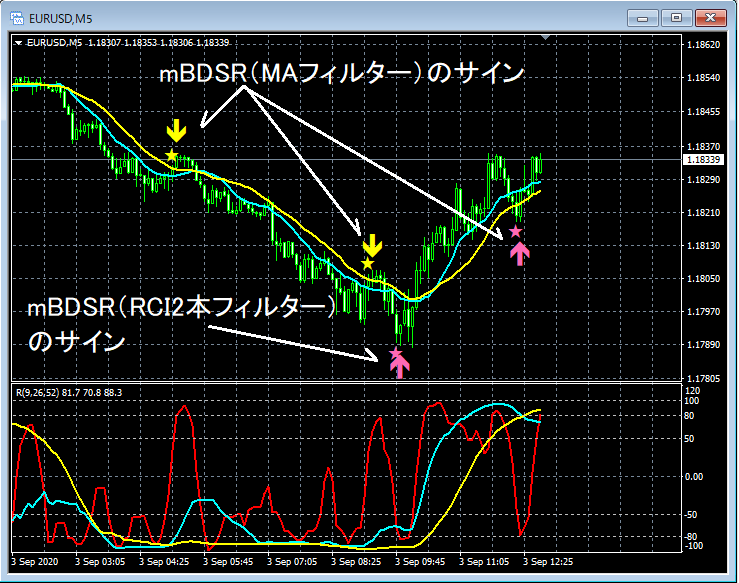
◆mBDSR (RCI2-filtered) signal examples
Main window:mBDSR (Filter: RCI26, RCI52)
Sub window: RCI3-line (RCI9,26,52)
(1) 1st mBDSR signal RCI3-line where clearly the only descending is RCI9this situation,mBDSR pullback-buy signallights up and price rises.
In this case,signal lights up just before the candle where RCI9 reversal is confirmed
(2) 2nd mBDSR signal
Only RCI9 is clearly rising among the RCIsthis situation,mBDSR pullback-selling signallights up and price declines.
In this case,signal lights up just before the candle where RCI9 reversal is confirmed
Also,the signal lights up when the candle four bars before the candle where RCI9 reversal downward is confirmed
(3) 3rd mBDSR signal
Only RCI9 is clearly descending among the RCIsthis situation,mBDSR pullback-buy signallights up and price rises.
In this case,signal lights up just before the candle where RCI9 reversal is confirmed
Also,the candle three bars before the candle where RCI9 reversal upward is confirmed
Back to contents
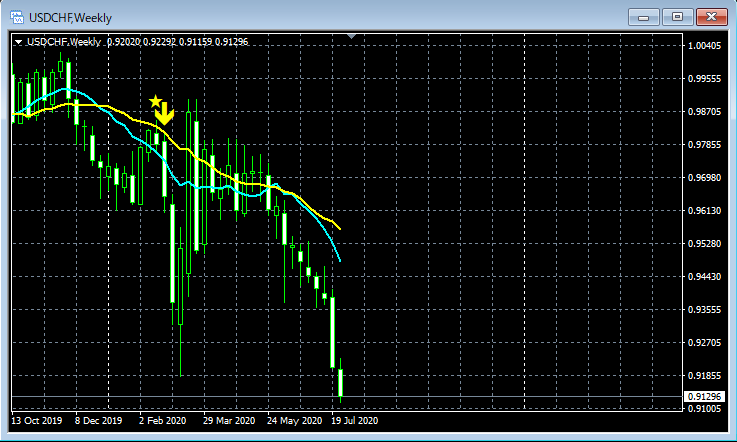
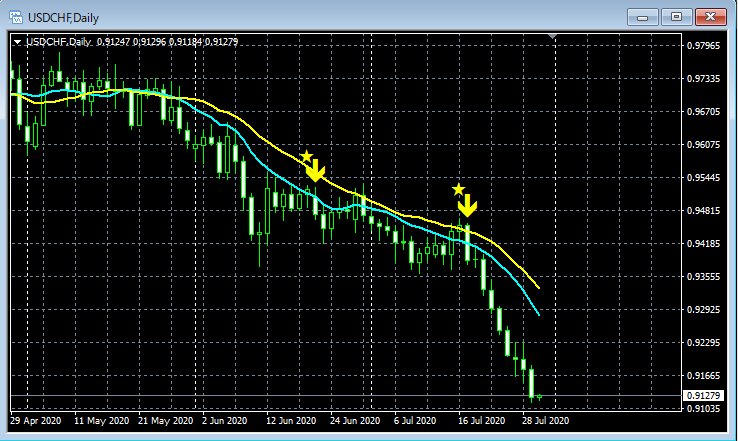
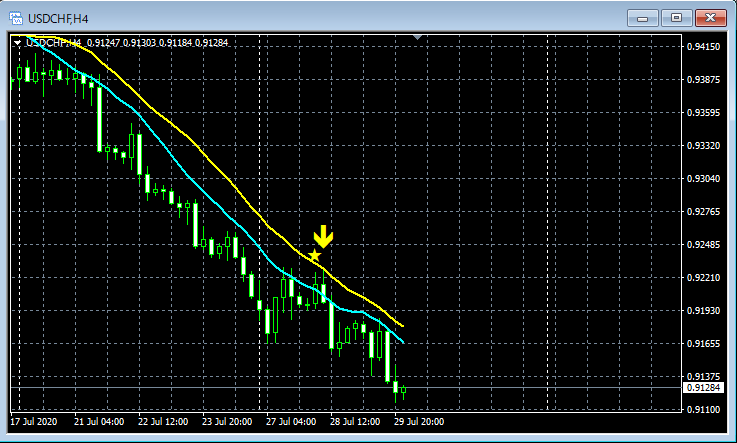
◆mBDSR (MA filter version) signal examples
The three charts below (GBP/CHF) are from the same day: weekly, daily, and 4-hour.
Weekly
Daily
4-hour
Back to contents
◆mBDSR (RCI2 filter) and mBDSR (MA2 filter) combined
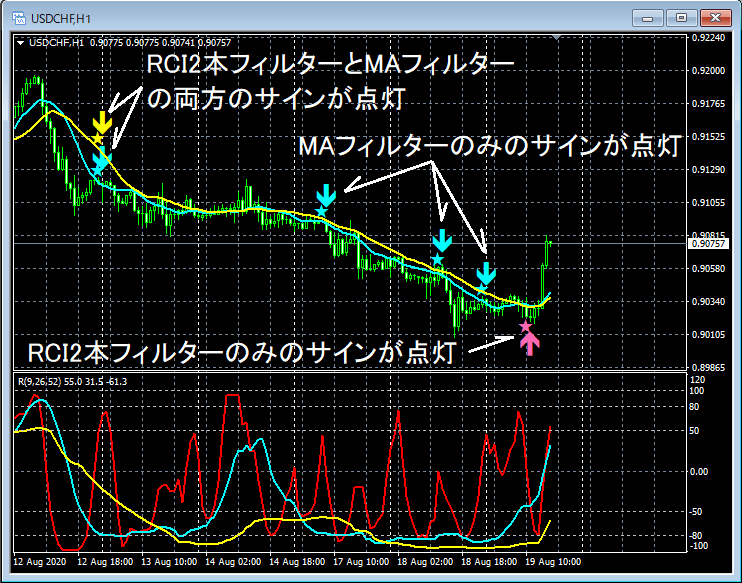
Thus, a brief introduction to mBDSR signals, but many chart examples of mBDSR signals are included in Investment Navigator+ and elsewhere.
Investment Navigator+
https://www.gogojungle.co.jp/finance/navi/series/359
Back to contents
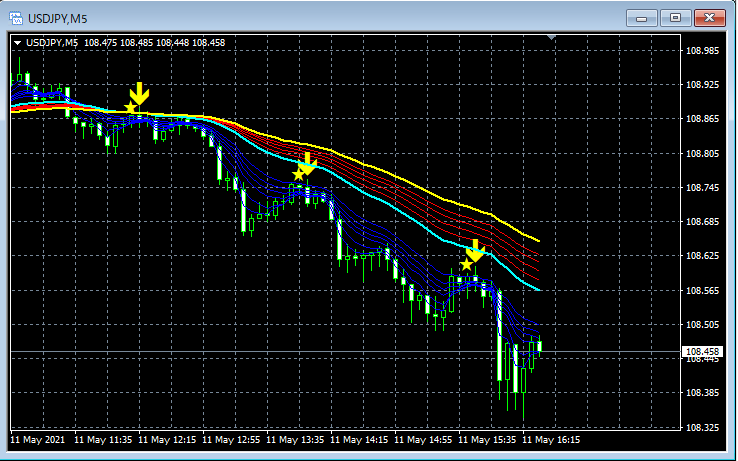
◆Chart example: mBDSR (MA filter) signals with GMMA displayed together
mBDSR (MA filter) signals andGMMA displayed together
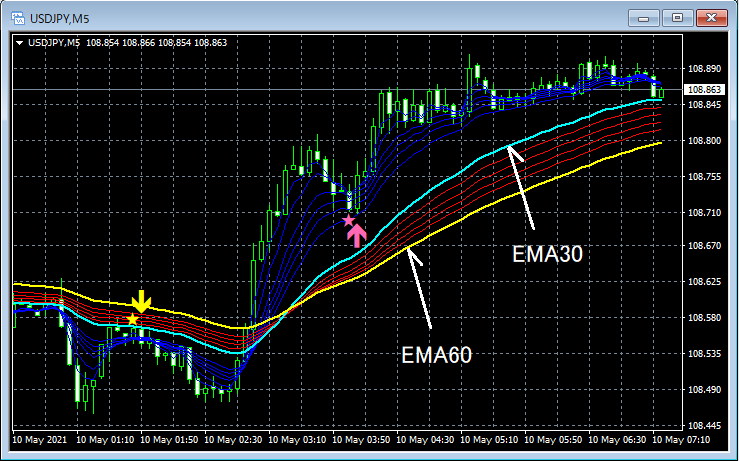
mBDSR (Filter: EMA30 and EMA60) signals
GMMA (EMA3,5,8,10,12,15,30,35,40,45,50,60)
Back to contents
◆Effective use of mBDSR signals (core of “RCImBDSR Market Reversal Theory”)
To effectively utilize the signals of “mBDSR (BODSOR)”, it is important to perform multi-time-frame analysis through RCI, understand the environment, cascade from higher to lower timeframes, and capture points where multiple entry bases align.
For this reason, I have occasionally compiled useful aspects into PDF files and added them to this product focusing on methods・case studies.
As of November 3, 2024, 358 PDFs are included. These PDFs use over 1,350 charts in total. Among them, the 11th and 14th PDFs are freely available; please see the below Investment Navigator+ articles for similar content if you're interested.
“Reasoning to Buy” for 'RCI 3-line + mBDSR' – Example of pullback buy on the 1-hour chart
Reasoning to Sell with 'RCI 3-line + mBDSR' – Example of pullback sell on the 1-hour chart (2)
The above two articles are freely available, but many other PDFs are not intended to be freely released.
These contents show how to logically link higher-timeframe scenarios with lower-timeframe considerations using RCI3-line, and ultimately wait for pullbacks on the lower timeframe (mBDSR signal). This is essentially the core of the RCImBDSR Market Reversal Theory.
Back to contents
◆Important version updates and recent updates
November 3, 2024
PDFs were added as appropriate, bringing the total to 358 PDFs.
October 29, 2023
Indicator 【R1R2S2】 was added.
May 11, 2021
Indicator GMMA was added. This indicator can display 12 EMAs (EMA3,5,8,10,12,15,30,35,40,45,50,60) in total on one chart.
December 11, 2020
PDFs 141–150 added.
Ten PDFs including “RCI3-line + mBDSR – Focus on EMA21 on the 1-hour chart and RCI9 at low value areas” etc.
May 9, 2020
A help file describing the six indicators included in the download file (help(Indicators_List)20200509.txt) was added to the download package.
The contents of this help file are also posted inInvestment Navigator+ articlesas well.
Important!! December 12, 2019
“mBDSR RCI Filter Version” was released and included in this product.
mBDSR_2RCI_VAP_XXXXXXXX.ex4 : 2 RCIs as filters
mBDSR_1RCI_VAP_XXXXXXXX.ex4 : 1 RCI as filter
For details, please seehttps://www.gogojungle.co.jp/finance/navi/359/17716.
Important!! December 9, 2019
“mBDSR Moving Average Filter Version” was released and included in this product.
(File name: mBDSR_MA2_VAP_XXXXXXXX.ex4)
For details, please seehttps://www.gogojungle.co.jp/finance/navi/359/17658.
November 30, 2018
Added the second generation main indicator 【mBDSR】.
Essentially an upgrade from BODSOR to mBDSR.
【BODSOR】 (First generation main indicator)
An indicator developed to increase entry accuracy when buying on pullbacks or selling on rallies using three-line RCIs.
【mBDSR】 (Second generation main indicator)
Concept is the same as BODSOR, but the arrow signal conditions and calculations are completely different. Because more arrow signals occur than BODSOR, there is a higher likelihood of capturing entry opportunities that BODSOR could not.
※It is an unpainted indicator.
※Currently, BODSOR is not the main indicator; mBDSR has become the primary.
Back to contents
◆Characteristics of mBDSR signal display
Regarding the final signals pink and yellow arrows, they are displayed at the same time as the open of the bar where the signal appears. In other words, they are based on the opening price. In other words, the signal is determined at the close of the preceding bar before the candle where the signal is displayed.
Back to contents
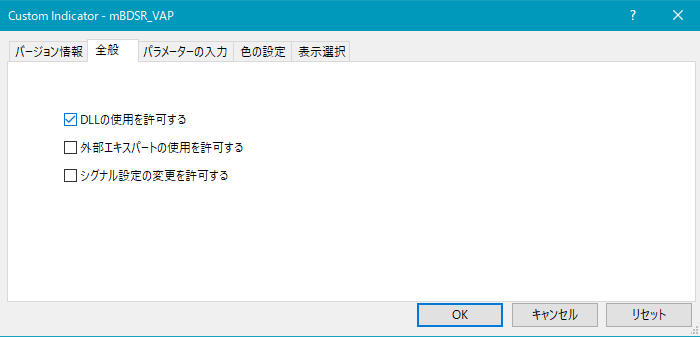
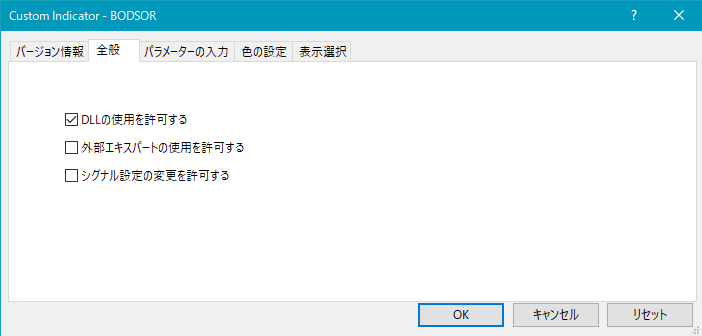
◆mBDSR settings (about the filter-less 【mBDSR_VAP】)
As shown below, you need to check “Allow DLL imports.”
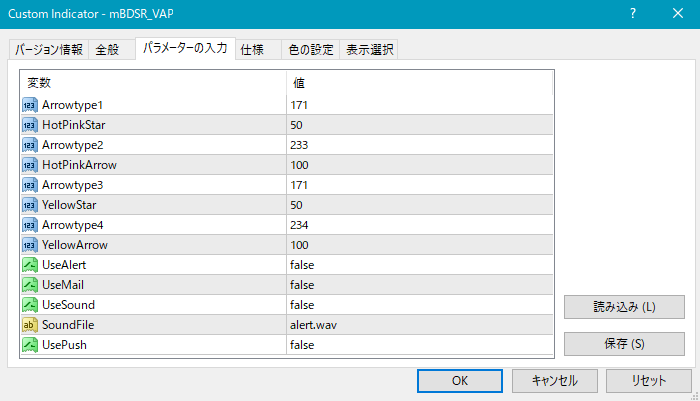
Settings for star and arrow display positions
If the stars/arrows are too close to the candles or too far away, sometimes they go off-screen. You can adjust the display height using the following settings. Higher values move the display farther from the candles.
Star (pink) → HotPinkStar
Arrow (pink) → HotPinkArrow
Star (yellow) → YellowStar
Arrow (yellow) → YellowArrow
Additionally, you can change the shape of stars/arrows (or substitutes) by adjusting the following values.
Pink star (default) → Arrowtype1
Pink star (default) → Arrowtype2
Red star (default) → Arrowtype3
Yellow star (default) → Arrowtype4
The symbols and corresponding numbers are listed in the table below (for star/arrows substitutes).
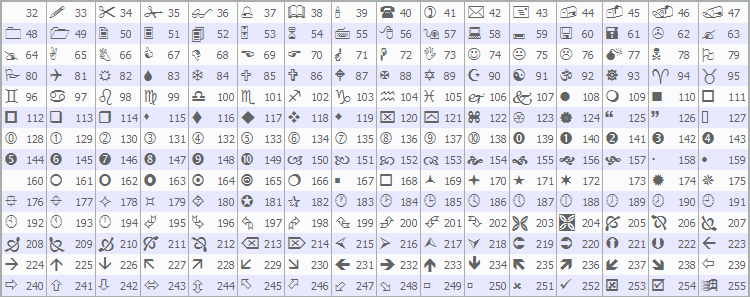
For changing stars/arrows, see the Investment Navigator+ article below.
https://www.gogojungle.co.jp/finance/navi/359/19177
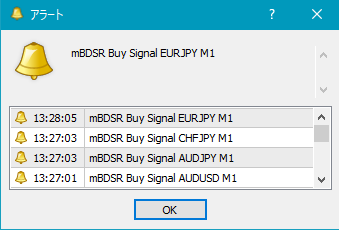
Alert function settings
UseAlert:
When using alert dialogs like shown below to notify signal generation, set to true; otherwise, set to false.
UseMail:
If you want to be notified by email, set to true; otherwise, false.
UseSound:
If you want to be notified by sound, set to true; otherwise, false.
SoundFile:
Enter the sound file name to use for alerts.
UsePush:
If you want to push notify, set to true; otherwise, false.
Example MT4 settings for email notification
Tools → Options → E-mail
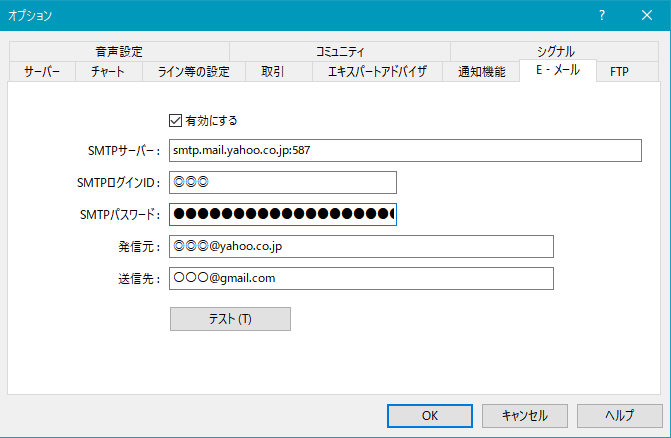
Note: It may require restarting MT4 after changing settings.
Back to contents
◆Details on the mBDSR RCI filter version
※Details on the mBDSR RCI Filter Versioncan be found in the Investment Navigator+ article below.
“mBDSR RCI Filter Version” Released!!
Back to contents
◆Details on the mBDSR Moving Average Filter Version
※Details on the mBDSR MA filter versioncan be found in the Investment Navigator+ article below.
“mBDSR Moving Average Filter Version” Released!!
Back to contents
◆Details on R1R2S2
※R1R2S2 was added on October 29, 2023. It is an indicator that aims to capture trend reversals・pullbacks・pullback timings using a different approach from mBDSR (RCI2-filter).
※Details on R1R2S2 can be found in the Investment Navigator+ article below.
RCI3-line “2-step decision” to target trend reversals・pullbacks with “R1R2S2” release!!
Back to contents
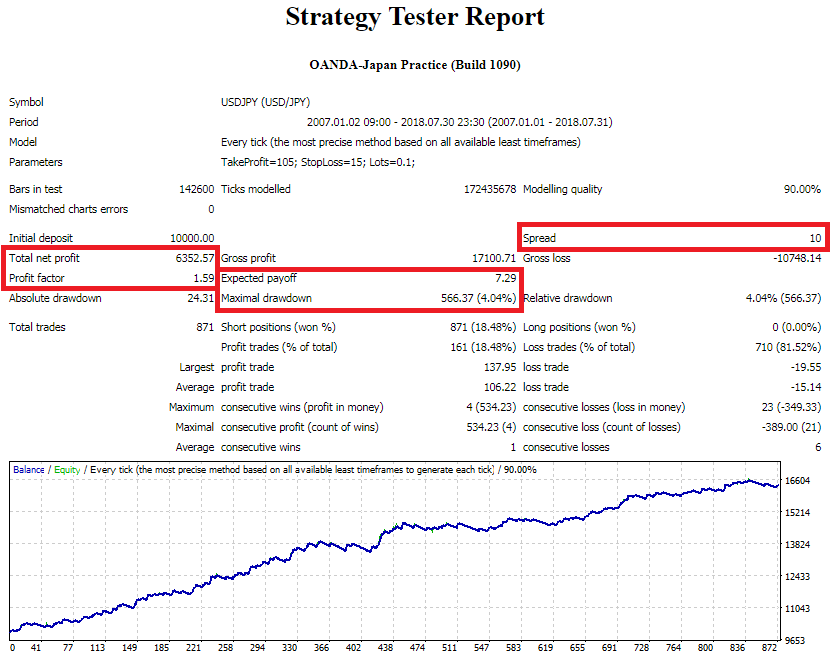
◆Verifying the effectiveness of mBDSR (RCI2-line filter) with EA
※An example of verifying the effectiveness of mBDSR (RCI2-line filter) with EA is described in the Investment Navigator+ article below.
“Verifying the effectiveness of 'RCI3-line + mBDSR' with EA”
Back to contents
◆Notes (mBDSR)
【mBDSR】 is developed to sense reversal signs of RCI9 as early as possible based on price action. Therefore, regardless of whether you use RCI/MA filters, an upward arrow (or downward arrow) lighting up on 【mBDSR】 does not guarantee price will rise (or fall) accordingly.
We cannot answer questions about the logic of this indicator.
In the charts shown in this article, circles/lines/rectangles may be added for explanatory convenience.
Please read this page carefully before purchasing.
Due to the nature of the product, returns/refunds are not offered.
Back to contents
◆“RCI3-line + mBDSR (no filter)” signal examples
The signals for “mBDSR” shown here are for the no-filter version. For signals with RCI as filters, many chart examples are posted on blogs and Investment Navigator+. For examplethis Investment Navigator+please refer to.
GBP/USD 15-minute
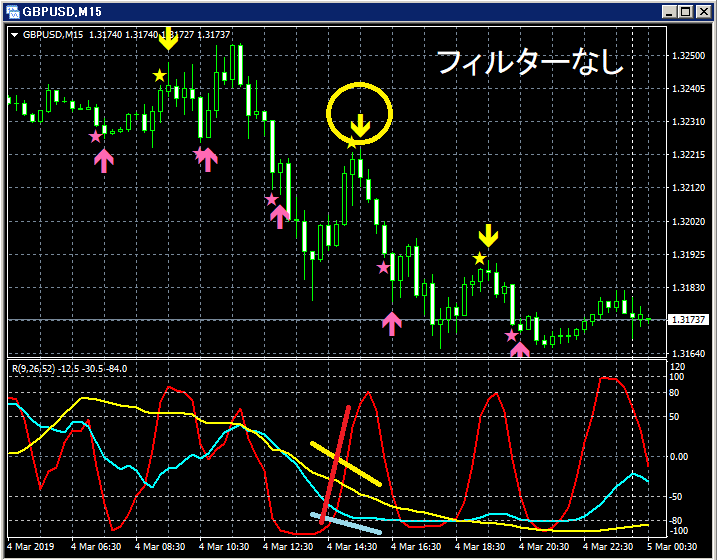
Among the three RCIs, only RCI9 is clearly rising.
If RCI9 reverses downward, all three RCIs may turn downward, indicating a strong decline in price.
In such a situation, the mBDSR pullback-selling signal (yellow arrows circled) lights up.
In the above example, after the pullback-selling signal lights up, five consecutive bearish candles appear, indicating a good timing for a downturn.
Also, the signal lights up at the candle four bars before the candle where the reversal upward of RCI9 is confirmed.
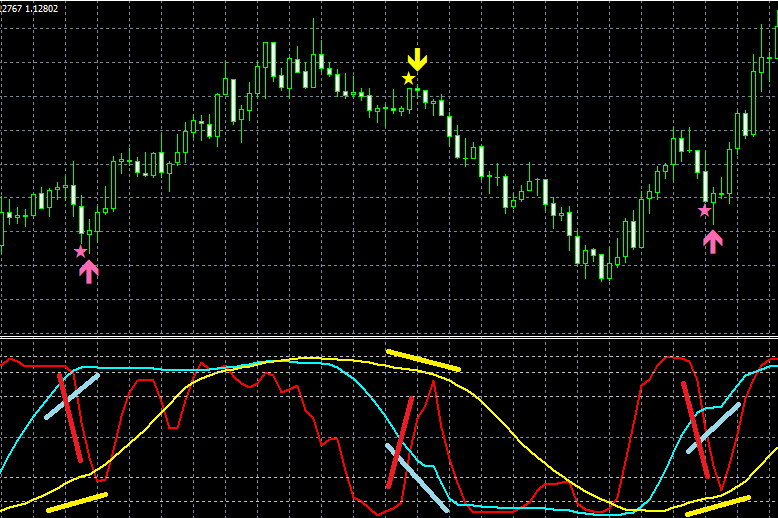
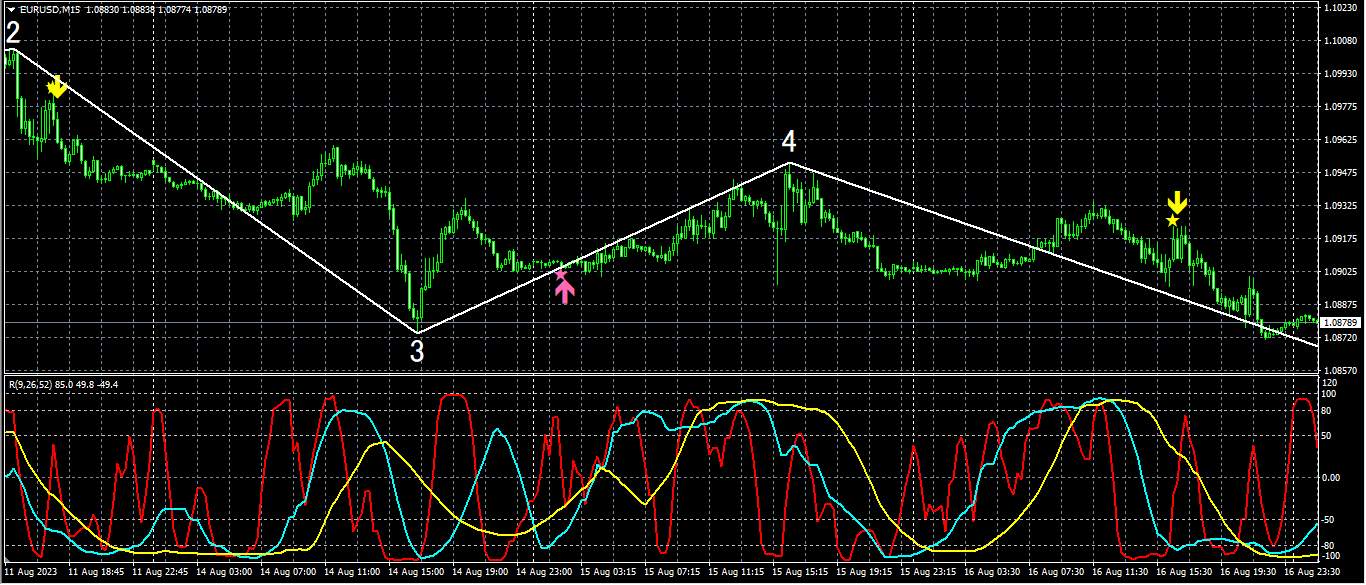
EUR/GBP 4-hour
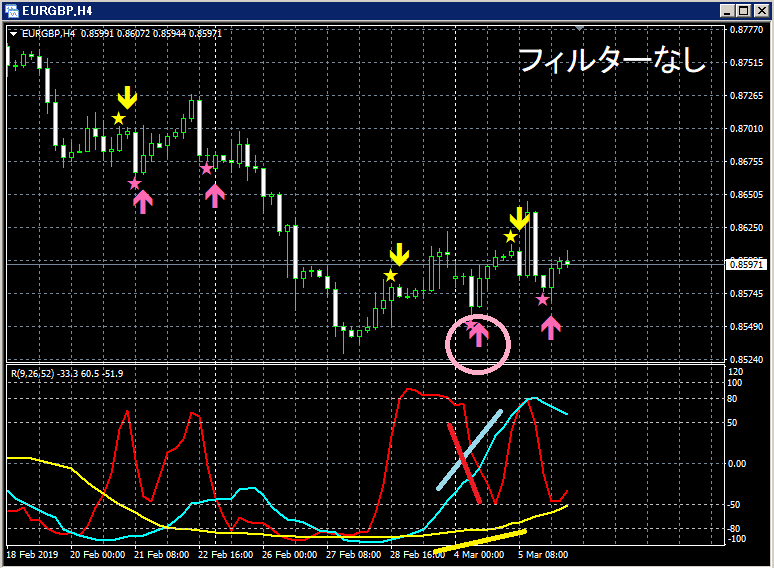
Among the RCIs, only RCI9 is clearly descending.
If RCI9 reverses upward, all three RCIs may rise, indicating a strong rise in price.
In such a situation, the mBDSR pullback-buy signal (pink arrows) lights up.
In the above example, the signal lights up after one bullish candle, and the subsequent candles rise.
Also, the candle four bars before the reversal upward of RCI9 confirms the pullback-buy signal.
Back to contents
◆“RCI3-line + mBDSR (no filter)” trend reversal examples
Here, signals shown are for the no-filter version. For the filtered version with RCIs, many examples are posted on Twitter, blogs, and Investment Navigator+. For examplethis Investment Navigator+please refer to.
EUR/GBP 30-minute
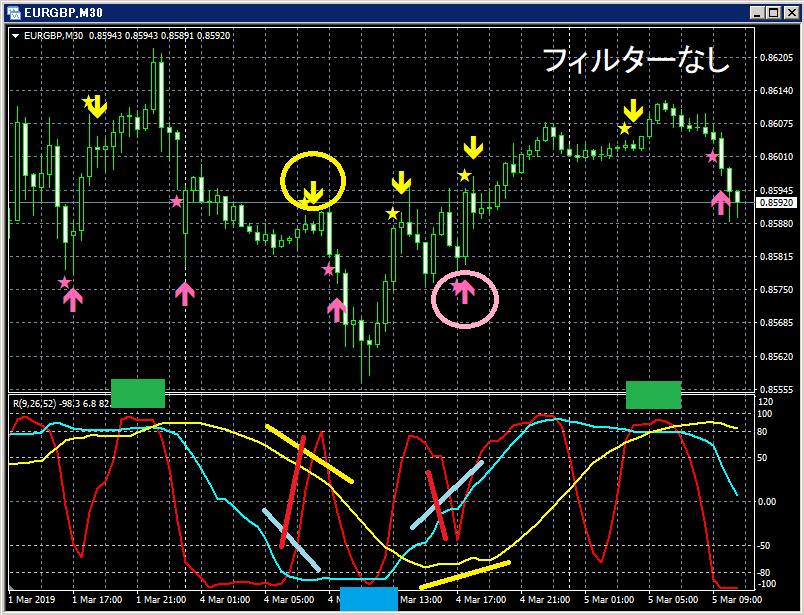
RCI3-line rises to the triple top (green box) → pullback-selling signal (yellow circle) → declines to the double bottom (blue box)
→ RCI52 reverses upward → pullback-buy signal (pink circle) → rises to the triple top (green box)
USD/CAD 5-minute
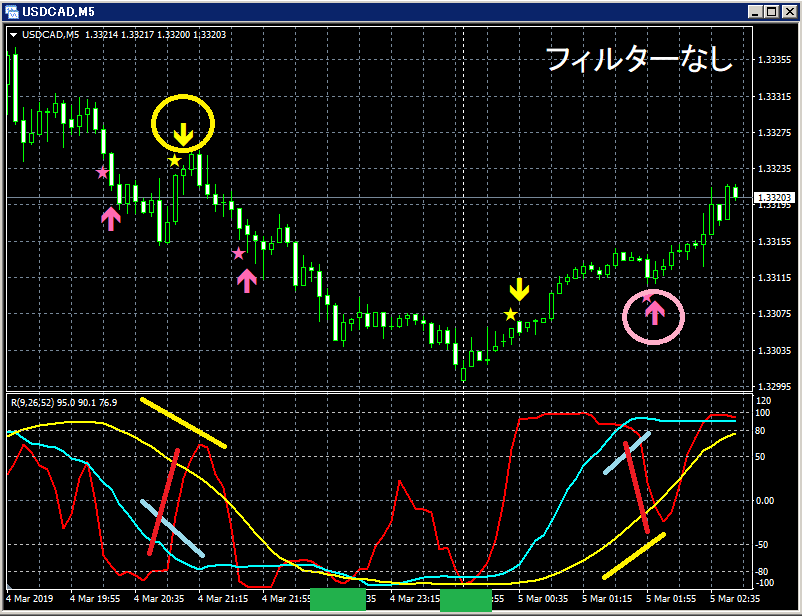
Pullback-selling signal (yellow circle) → decline to the double bottom (green box)
→ rise via pullback-buy signal (pink circle)
Back to contents
◆“mBDSR (RCI2 filter)” signals and trend reversals and double bottoms/double tops
GBP/CAD 1-minute
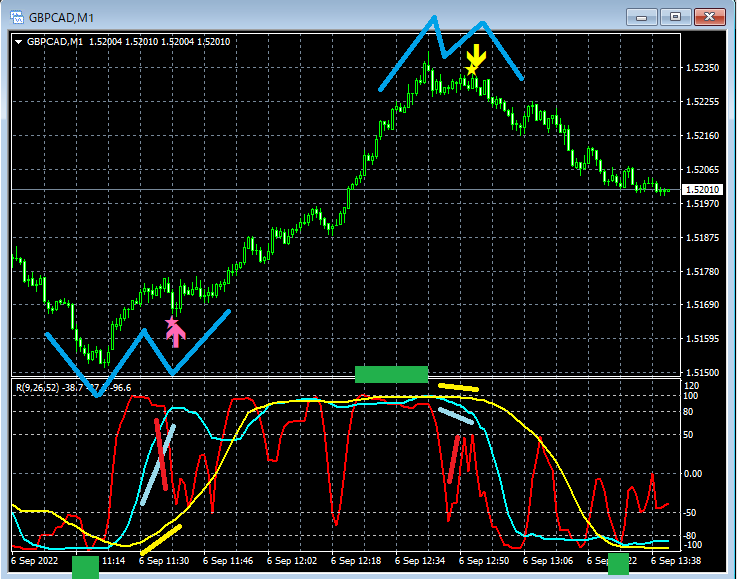
Note: This product does not include an indicator that displays double tops or double bottoms. Please be aware.
From a rise starting at the triple bottom (green box) to the right leg of the double bottom, mBDSR pullback-buy signal (pink) lights up and price rises; then it rises to the triple top (green box) and the pullback-selling signal (yellow) lights up, causing a decline; price declines to the double bottom (green box).
Double bottoms and double tops are important chart patterns and are closely tied to the signals of “mBDSR (RCI2-filter).”
Back to contents
◆“mBDSR (RCI2-filter)” signals and trend reversals and necklines of head-and-shoulders
EUR/USD 5-minute
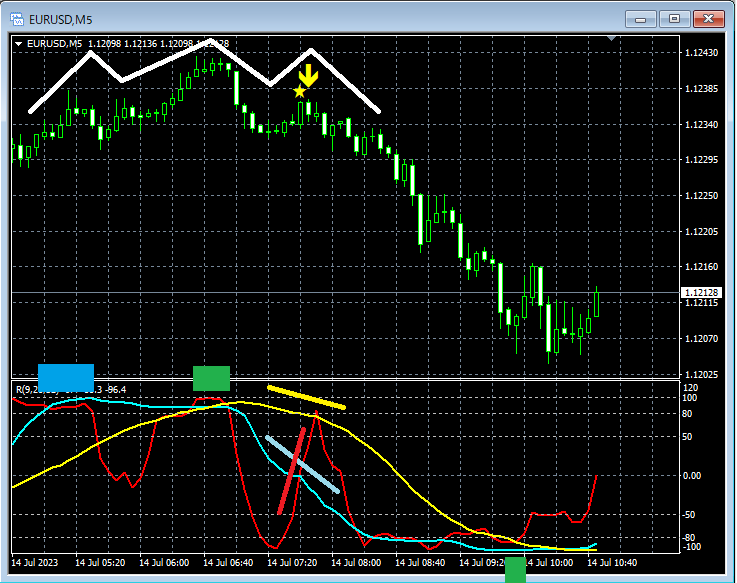
Note: This product does not include an indicator that displays head-and-shoulders or inverse head-and-shoulders; please beware.
RCI2 top and left shoulder rise → central peak at RCI3 top → right shoulder; mBDSR pullback-selling signal lights up on the right shoulder and price declines; then price declines to the double bottom (green box)
Head-and-shoulders patterns are important chart patterns, and are considered in relation to mBDSR signals.
Back to contents
◆“mBDSR (RCI2-filter)” signals and necklines of head-and-shoulders
AUD/CAD 30-minute
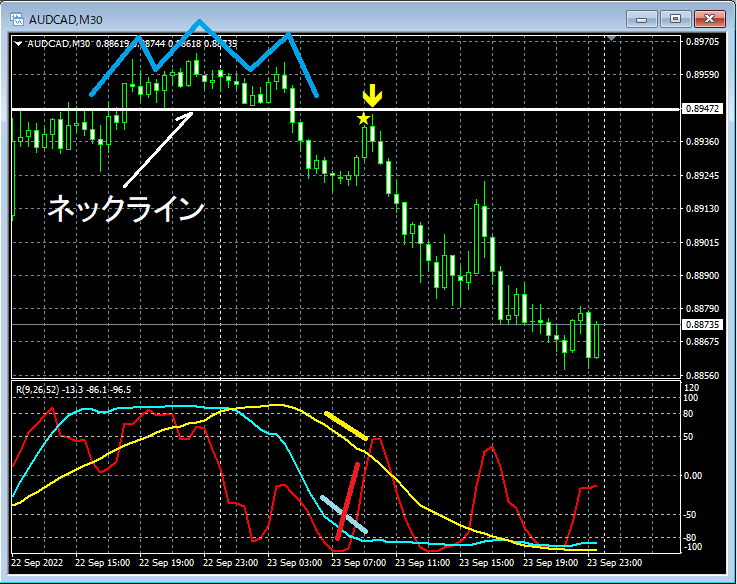
Note: This product does not include indicators to display head-and-shoulders or their necklines.
In this example, the mBDSR (RCI2-filter) pullback-signal lights up around the neckline after backing out to that point.
The idea that necklines of head-and-shoulders patterns function as support/resistance and relate to mBDSR signals is important, and is a point of high compatibility with other methods.
Back to contents
◆Bounce from an ascending trendline and mBDSDR (RCI2-filter) signal
USD/CAD 15-minute
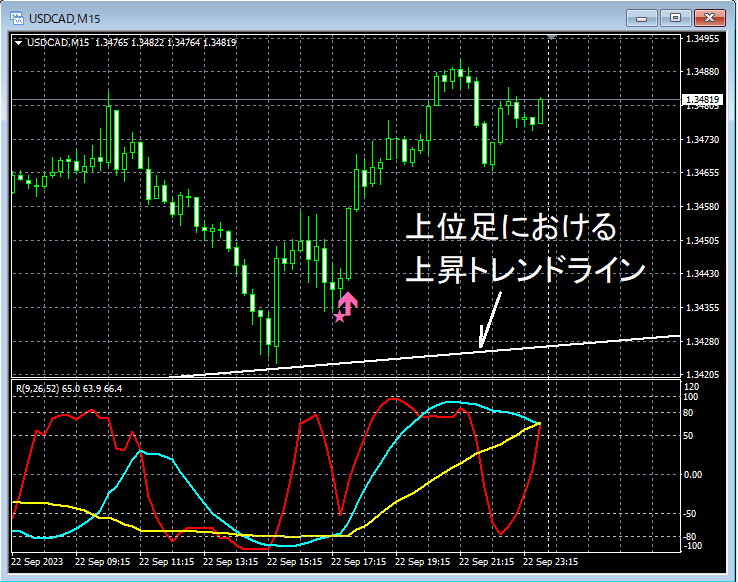
Note: This product does not include an indicator to display trendlines, so please be aware.
⇒ Investment Navigator+ articleRCI3-line and bounce from an ascending trendline and mBDSR signal
https://www.gogojungle.co.jp/finance/navi/articles/60242
In this example, price rebounds around an ascending trendline on the higher timeframe, and the mBDSR (RCI2-filter) pullback-buy signal lights up at an opportune time.
From another perspective, RCImBDSR Market Reversal Theory emphasizes the use of high-timeframe trendlines as support/resistance for entry decisions and can be used as one of the entry decision materials. It is highly compatible with other methods.
Back to contents
◆EMA and past notable lows and double tops and mBDSDR (RCI2-filter) signals
GBP/AUD 5-minute
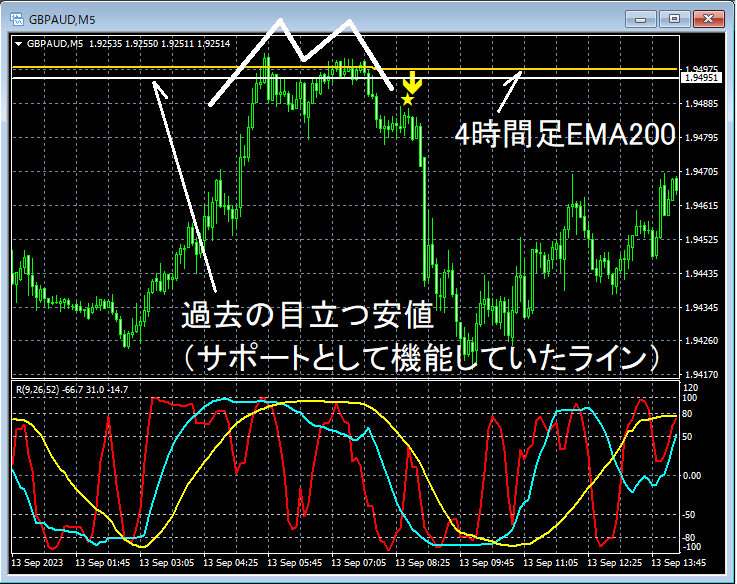
Note: This product does not include indicators displaying higher-timeframe moving averages, past notable highs/lows, or double tops; please be aware.
⇒ Investment Navigator+ articleRCI3-line and EMA and past notable lows and mBDSR signals (multiple entry basis)
https://www.gogojungle.co.jp/finance/navi/articles/60013
As price rose to around the 4-hour EMA200 and near the past notable lows on the 1-hour timeframe, a double top formed and reversed. During the fall, an mBDSR signal lit up, and the decline accelerated.
From another viewpoint, RCImBDSR Market Reversal Theory also emphasizes echoing with:
● A method that places importance on moving averages as support/resistance
● A method that places importance on past notable highs/lows as support/resistance
Thus, it can be used as one of the entry decision materials. It is highly compatible with other methods.
Back to contents
◆mBDSR signals and counter-trend lines and pullback highs and Fibonacci retracement
NZD 15-minute
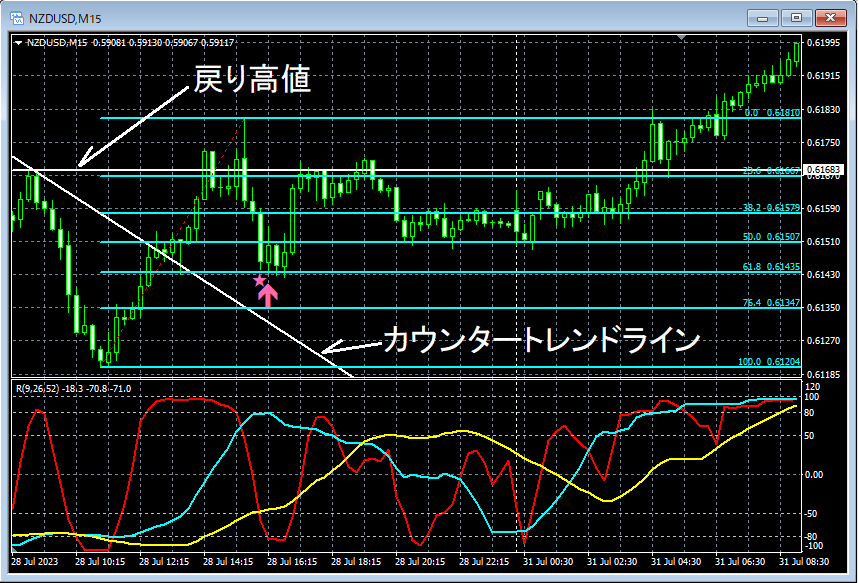
Note: This product does not include indicators displaying counter-trend lines or pullback highs or Fibonacci retracements.
After breaking above counter-trend lines and pullback highs, the price retraces around 61.8% using Fibonacci retracement, and the mBDSR pullback-buy signal (pink) lights up as price rises.
From another perspective, RCImBDSR Market Reversal Theory emphasizes using Fibonacci retracement to measure the depth of pullbacks during market reversals
and can be used as one of entry decision materials. It is highly compatible with other methods.
Back to contents
◆Drops and pullback highs and mBDSR signals and Fibonacci retracement
GBP/USD 5-minute
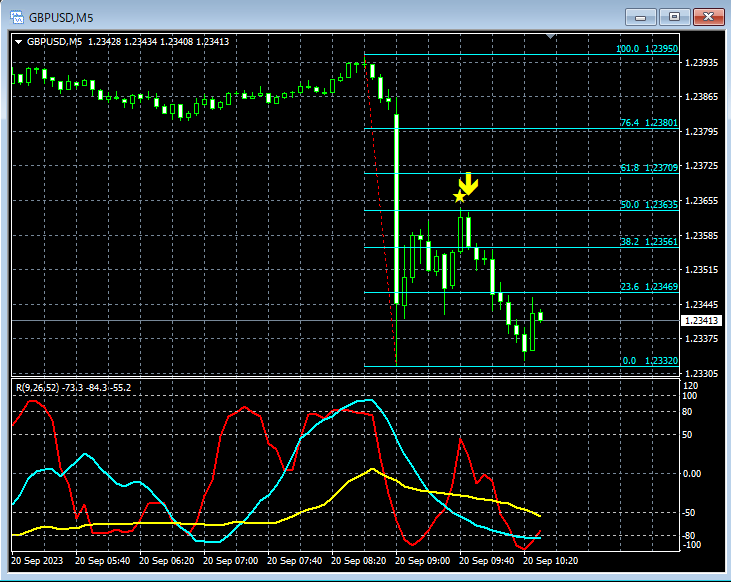
Note: This product does not include an indicator to display Fibonacci retracements.
⇒ Investment Navigator+ articlemBDSR signals and post-news sharp moves, pullbacks, and Fibonacci retracement
https://www.gogojungle.co.jp/finance/navi/articles/60285
After the indicator release, price drops. The mBDSR pullback-sell signal lights up at around 50.0% retracement in Fibonacci levels, indicating timing for a move lower.
Here, the details of higher-timeframe conditions are omitted, but this is an example of applying multi-time-frame analysis with RCI to wait for mBDSR signals.
From another point of view, RCImBDSR Market Reversal Theory encompasses the following:
● Use of Fibonacci retracement to measure pullback depth during sharp moves
and can be used as entry decision material. It is highly compatible with other methods.
Back to contents
◆Return pullbacks to pullback highs and mBDSR signals
GBP/JPY 5-minute
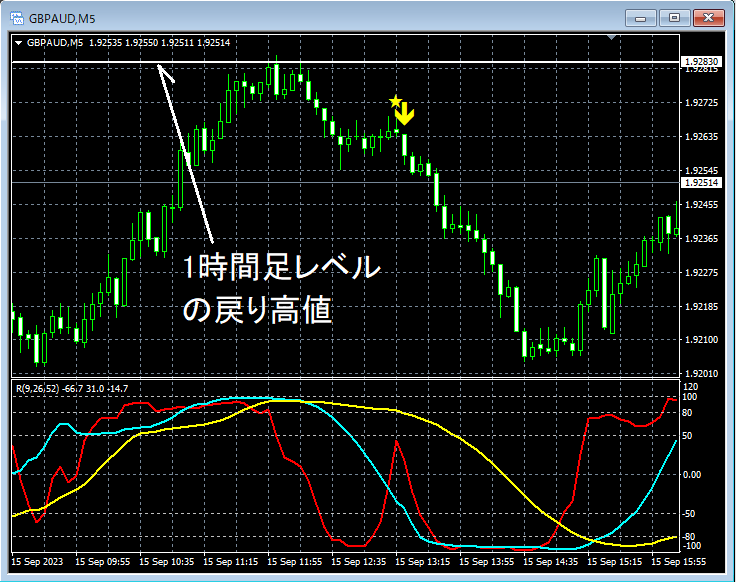
Note: This product does not include an indicator to display pullback highs.
⇒ Investment Navigator+ articleRCI3-line and pullback highs with mBDSR signals https://www.gogojungle.co.jp/finance/navi/articles/60016
After rising toward the pullback high on the 1-hour chart, price declines. The mBDSR signal lights up during this pullback, accelerating the move lower.
In another view, RCImBDSR Market Reversal Theory can also be used as part of other methods for entry decisions, such as
● Emphasizing past notable highs/lows as support/resistance
Thus, it can be used as one entry decision factor, and harmonizes well with other approaches.
Back to contents
◆Elliott Wave and mBDSR (RCI2-filter) signals
EUR/USD 15-minute
Note: This product does not include an indicator to display Elliott Wave.
During the third wave, pullback-buy signals light up during a retracement; during wave 4 rise, pullback buy; during wave 5, pullback-sell signals light up.
In this way, compatibility with other methods remains high.
Back to contents
<About PDF File 1>
◆PDF-1: Tips for leveraging “RCI3-line + mBDSR” in trading
Included in the companion【PDF file: mBDSRhint1_20200903V1.pdf】summarizes the following through chart analysis examples:
● Sell timing tests at the 4-hour level
● Sell timing tests at the 1-hour RCI2 double-top
● Sell timing tests at the 30-minute RCI3 double-top
● Sell timing tests at the 15-minute RCI3 double-top
● Sell timing tests at the 5-minute RCI3 double-top
● Sell timing tests at the 1-minute RCI3 double-top
Using the “pullback from the four-hour-level upper limit” as a topic, links upper and lower timeframes logically using RCI3-line to wait for pullback timing on the lower timeframe (mBDSR signals).
This PDF deepens understanding of how to apply content from the free PDFs in actual trading.
Hints for using RCI【Free PDF】
https://www.gogojungle.co.jp/tools/indicators/16863
Back to contents
<PDF files 2~4>
◆PDF-2 – 4: Hints for leveraging “RCI3-line + mBDSR” in trading-2 – 4
Second companion PDF【mBDSRhint2_20200903V1.pdf】
“RCI3-line + mBDSR” trading hints-2
Using RCI3-line to logically link higher and lower timeframes, and progressively analyze the monthly to lower timeframe (week, day) scenarios, ultimately waiting for the daily-level pullback timing (mBDSR signal).
Third companion PDF【mBDSRhint3_20200903V1.pdf】
“RCI3-line + mBDSR” trading hints-3
Using RCI3-line to logically link daily and 4-hour charts, waiting for pullbacks on the 4-hour timeframe (mBDSR signals).
Fourth companion PDF【mBDSRhint4_20200903V1.pdf】
“RCI3-line + mBDSR” trading hints-4
Linking 4-hour and 1-hour charts logically via RCI3-line to wait for pullback timing on the 1-hour timeframe (mBDSR signals).
Back to contents
<PDF-5 to PDF-9>
◆About PDF-5 ~ 9
“5th PDF: Pullback strategy in triple-top scenario”
The 5th companion PDF【mBDSRhint5_20200903V1.pdf】Shows, for a daily triple-top scenario, how to logically link higher/lower timeframes using RCI3-line and wait for pullbacks on lower timeframes (mBDSR signals) across 4-hour, 1-hour, and 5-minute timeframes.
“An example of pullback-buy strategy using mBDSR signals”
6th PDF【mBDSRhint6_20200903V1.pdf】Describes waiting for pullbacks on the 5-minute timeframe by applying RCI3-line logical linking from 1-hour timeframe to 5-minute timeframe.
“RCI triple bottom strategy”
7th PDF【mBDSRhint7_20200903V1.pdf】Uses the daily triple bottom scenario to link higher and lower timeframes and wait for pullbacks on the lower timeframes (4-hour, 1-hour, 5-minute).
“Hints for selecting timeframes for range trading”
8th PDF【mBDSRhint8_20200903V1.pdf】For a 4-hour range market, demonstrates linking higher and lower timeframes using RCI3-line and analyzing from 4-hour to lower timeframes (1-hour, 60m, 30m, 15m) to wait for the 15-minute pullback-buy timing (mBDSR signal).
“RCI3-line: important patterns and combination of 5-minute and 1-minute timeframes”
9th PDF【mBDSRhint9_20200626.pdf】Focuses on 5-minute and 1-minute timeframes, summarizing“RCI3-line: important patterns and 5-minute/1-minute combinations”
Back to contents
<PDF-10 – 20>
◆PDF-10 – 20
10th companion PDF【mBDSRhint10_20200705.pdf】Covers, for 15-minute and 1-hour timeframe examples, the topic of“RCI3 Line + mBDSR: Entry Basis”.
11th companion PDF【mBDSRhint11_20200707.pdf】Examples for 1-hour pullbacks“Consider the entry basis for buying with ‘RCI3-line + mBDSR’ on a 1-hour pullback”.
This 11th PDF is freely available; see the following Investment Navigator+ article for similar content. If interested, please take a look.
‘Reasoning to Buy with RCI3-line + mBDSR’ – 1-hour pullback buy example
12th companion PDF【mBDSRhint12_20200711.pdf】Examples for 4-hour pullbacks“Reasoning to Sell with RCI3-line + mBDSR”.
13th companion PDF【mBDSRhint13_20200718.pdf】“RCI3-line + mBDSR – a very strong (weak) 1-hour pattern”Summarizes the 1-hour and 5-minute timeframe combinations.
14th companion PDF【mBDSRhint14_20200725.pdf】Example of 1-hour pullback-selling entry basis“Think about selling with RCI3-line + mBDSR”.
This 14th PDF is freely available; see the Investment Navigator+ article below for similar content. If interested, please review.
“Reasoning to Sell with RCI3-line + mBDSR” – 1-hour pullback selling example (2)
15th companion PDF【mBDSRhint15_20200727.pdf】Uses USD/JPY 15-minute chart as an example of “GOTO date” aligned timing.
16th companion PDF【mBDSRhint16_20200728.pdf】“An example of contrarian using the neckline in head-and-shoulders with mBDSR”USD/JPY 4-hour and 1-hour charts used.
17th companion PDF【mBDSRhint17_20200730.pdf】“Example of the MA filter version settings of mBDSR”using USD/CHF weekly, daily and 4-hour charts.
18th companion PDF【mBDSRhint18_20200803.pdf】mBDSR MA filter version vs RC I filter version usage with EUR/USD 15-minute chart.
19th companion PDF【mBDSRhint19_20200804.pdf】“RCI3-line + mBDSR – focusing on recent highs”Using USD/JPY 1-hour and 5-minute charts.
20th companion PDF【mBDSRhint20_20200903V1.pdf】“RCI3-line + mBDSR – drill down from 1-hour to 5-minute and 1-minute”Using EUR/USD with higher timeframe focus to logically link upper and lower timeframes from 1-hour down to 1-minute, awaiting pullback timing on 5-minute/1-minute for mBDSR signals.
Back to contents
<PDF-21 – 358>
◆PDF-21 – 30
~Lower timeframes down to 1-hour double bottoms (example)~
21st companion PDF【mBDSRhint21_20200807.pdf】Shows how to logically link higher/lower timeframes using three-line RCIs from 1-hour RCI2 double-bottom rising into lower timeframes and wait for pullback buy timing on 5-minute (mBDSR signal). Also covers mBDSR RCI2 filter combination.
22nd companion PDF【mBDSRhint22_20200903V1.pdf】With the monthly chart in a weak form, using RCI3-line to progress downwards to weekly, daily, 4-hour, 1-hour, etc., then waiting for pullback timing at the 1-hour timeframe (mBDSR signal).
23rd companion PDF【mBDSRhint23_20200903V2.pdf】With a very strong monthly, using RCI3-line to cascade down to lower timeframes to eventually wait for pullback timing on 30-minute timeframe.
24th companion PDF【mBDSRhint24_20200903V1.pdf】Cascading to lower timeframes (weekly, daily, 4-hour, 1-hour, 30m, 15m, 5m) to wait for pullback timing on 5-minute.
25th companion PDF【mBDSRhint25_20200816.pdf】Shows how to link monthly to lower timeframes with trendline focus and wait for pullback timing on 1-hour (mBDSR signal).
26th companion PDF【mBDSRhint26_20200903V1.pdf】From daily triple-top, how to link higher/lower timeframes to consider pullbacks in lower timeframes.
27th companion PDF【mBDSRhint27_20200903V1.pdf】From 4-hour double-top, consider pullback timing in lower timeframes.
28th companion PDF【mBDSRhint28_20200820.pdf】From daily down to lower timeframes, analyzing to wait for 5-minute pullback buy timing (mBDSR signal).
~Emphasizing resistance (trendlines also considered)~
29th companion PDF【mBDSRhint29_20200821.pdf】Reviews weekly resistance in EUR/JPY and pullback timing on 1-hour timeframe (mBDSR signal).
30th companion PDF【mBDSRhint30_20200903V1.pdf】With doubles in mind, links higher to lower timeframes logically from 4-hour to 1-hour, 5-minute, etc., to wait for pullback timing on the 5-minute timeframe (mBDSR signal).
Back to contents
<PDF-31 – 358>
◆PDF-31 – 358
The titles and summaries of all 358 PDFs (PDF-1 to PDF-358) are summarized in the Investment Navigator+ article below.
【BODSOR・mBDSR】 358 accompanying PDFs
https://www.gogojungle.co.jp/finance/navi/articles/34271
Back to contents
<About BODSOR>
◆BODSOR Development History
“RCI3-line + BODSOR” to pullback buy and pullback sell
One feature of RCI 3 lines (RCI9, RCI26, RCI52) is“When all three RCIs point in the same direction, price movement in that direction tends to be larger”there may be cases.
If RCI26 and RCI52 rise (fall) and RCI9 falls (rises), and RCI9 reverses,“RCI9 aligns in the same direction as the other two”This meansit is crucial to sense when RCI9 will reverse.
(However, case by case, waiting for a simple reversal of RCI9 can often cause significant delay.)
Therefore, to avoid delays in such situations, price action-based signals were used to detect reversal signs of RCI9 as early as possible, which led to the development of BODSOR.
Upper: BODSORLower: RCI3-line (RCI9,26,52)
※This indicator (BODSOR) includes an indicator that displays the three RCIs.
※However, you do not need to install the RCIs display indicator to use BODSOR.
※Therefore, if you already display RCIs or you don’t need RCIs, you do not need to install the included RCIs display indicator to use BODSOR.
Pullback buying:
When the blue star appears and the next candle’s open shows the pink star, thepink arrowis displayed.
On the chart above, the pink ellipse area shows a case where only RCI9 was clearly declining among RCIs, and BODSOR pullback-buy signal lit up and worked well.(In this example, BODSOR signal lit up four candles before the reversal of RCI9.)
Pullback selling:
When the blue star appears, the next candle shows the yellow star, and theyellow arrowis displayed at the next candle’s open.
On the chart above, the yellow ellipse area shows a case where only RCI9 is rising among RCIs, and BODSOR pullback-selling signal lit up and functioned well.(In this example, BODSOR signal lights up four candles before the reversal of RCI9.)
Back to contents
◆BODSOR signal display features
Signals (arrows) do not appear abruptly without warning. In pullback-buy example above, when the blue star appears on one bar, the pink star appears on the next bar, and the final signal pink arrow appears at the next bar’s open. Therefore, you can observe RCI9 movement and wait for the signal to light up.
The final signals pink arrow and yellow arrow appear at the open of the candle where they appear. Thus, signals are based on the opening price. In other words, the signal is determined when the prior candle closes.
Back to contents
◆BODSOR Settings
As shown below, you need to check “Allow DLL imports.”
Settings for star and arrow display positions
If the stars/arrows are too close to candles or too far, sometimes they go off-screen. Adjust the height values below to fix; larger values move the display away from the candles.
Star (blue) → BlueStar
Star (pink) → HotPinkStar
Star (red) → RedStar
Star (yellow) → YellowStar
Arrow (pink) → HotPinkArrow
Arrow (yellow) → YellowArrow
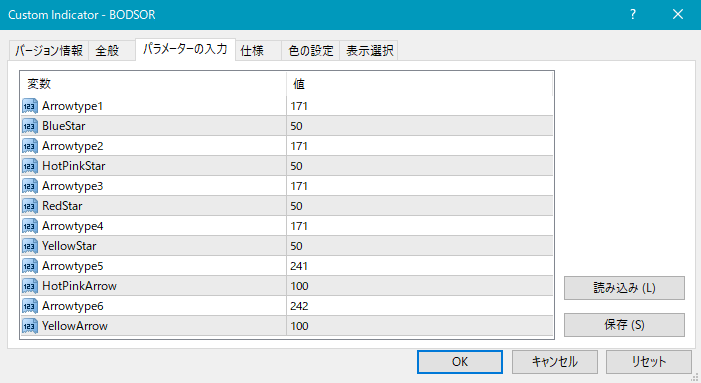
Additionally, you can change the shape of stars/arrows or substitutes by adjusting the following values.
Star (pink) → Arrowtype1
Star (pink) → Arrowtype2
Star (red) → Arrowtype3
Star (yellow) → Arrowtype4
Arrow (pink) → Arrowtype5
Arrow (yellow) → Arrowtype6
The symbols and their corresponding numbers for stars/arrows are listed in the table below.
For changing stars/arrows, see the Investment Navigator+ article below.
https://www.gogojungle.co.jp/finance/navi/359/19177
Back to contents
◆Notes (BODSOR)
【BODSOR】 was developed to quickly sense reversal signs of RCI9 based on price action. Therefore, lighting up an upward arrow (downward arrow) does not guarantee price will move accordingly.
We cannot answer questions about the logic of this indicator.
In the charts shown here, for explanation convenience, circles/lines/rectangles may have been drawn. Please understand.
Please read the product description page (this page) carefully before purchasing.
Back to contents
◆Other (Investment Navigator+, Blacksun indicators list)
Investment Navigator+
Pullbacks・Rally Buy: RCI3-line + BODSOR (mBDSR) usage examples
https://www.gogojungle.co.jp/finance/navi/series/359
=========================================
Blacksun indicators (list)arehere’s Investment Navigator+ articleplease refer to.
https://www.gogojungle.co.jp/finance/navi/articles/33779
=========================================