

AUDJPY: Past notable highs, counter-trend line, and mBDSR (RCI two-filter) pullback buying signal - April 5, 2024
AUDJPY 5-minute chart
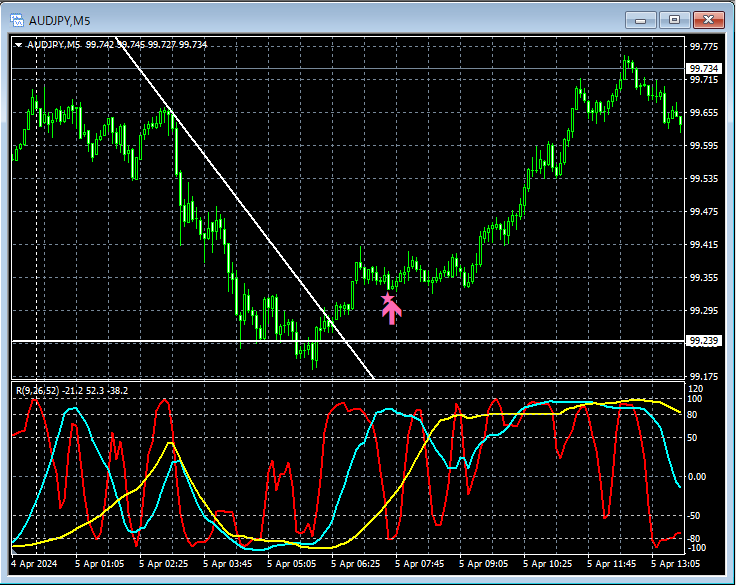
In the 5-minute chart above,a horizontal line indicating notable past lowsnear which price rebounded, and thena counter-trend linewas broken to the upside, followed by a declinemBDSR (RCI two-lines filter) buy-the-dip signallighting up as it rose.
From this example,a trading method focusing on notable past lows and counter-trend linesandthe signals of mBDSRshow strong compatibility.
Indicators that excel in combination with RCI 【BODSOR・mBDSR】
and the method & case studies (PDF) ★GogoJungle AWARD 2020 Winner★
https://www.gogojungle.co.jp/tools/indicators/11836
The PDF file includes 283 items.
Many of them describe how to logically link higher and lower timeframes using three RCI lines, sequentially consider the situations of multiple lower timeframes, and ultimately wait for a timing to buy on dips or sell on rallies on lower timeframes (i.e., signals of mBDSR).They also emphasize capturing points where multiple entry bases overlap.
In the explanations,over 1,000 charts have been used.
.

× ![]()


