

Euro dollar 1-minute chart, aiming for the third wave of the 5-minute chart!!
Euro Dollar 1-minute Chart
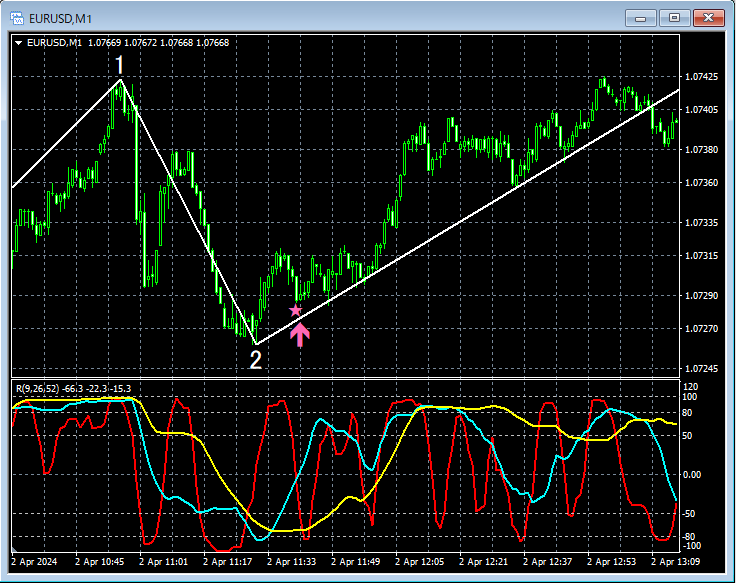
The 1-minute chart above showsthe 5-minute Elliott Wave countdisplayed.Initial movement of the 3rd wave on the 5-minute chartisthe 1-minute mBDSR (RCI two-filter) pullback buy signalilluminated and rising.
From this example,the trading method aimed at the 3rd waveandthe mBDSR signalshow a strong synergy.
Indicators that shine in combination with RCI: 【BODSOR・mBDSR】
and their method & case studies (PDF) ★GogoJungle AWARD 2020 winner★
https://www.gogojungle.co.jp/tools/indicators/11836
283 PDF files are included.
Many of them describe how to logically link higher and lower timeframes using three RCI lines, sequentially analyzing multiple lower-timeframe conditions, and ultimately wait for pullback buys or pullback sells on the lower timeframe (i.e., the mBDSR signals).They also focus on identifying points where multiple entry signals coincide.
Explanation usesmore than 1,000 charts in total..

× ![]()


