

Euro Australian Dollar April 2, 2024
Euro-Aud 30-minute chart
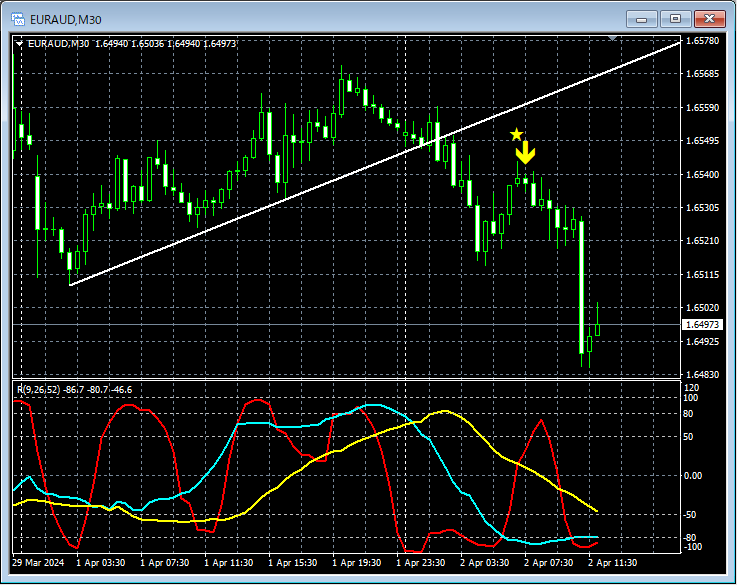
In the 30-minute chart above,Counter-trend lineafter breaking below, the risemBDSR (RCI two-line filter) return-sell signallights up and prices drop.
From this example,a trading method focusing on the counter-trend lineandthe signal of mBDSRshow a high degree of compatibility.
Indicator that shines in combination with RCI【BODSOR・mBDSR】
and method, case studies (PDF) ★GogoJungle AWARD 2020 Winner★
https://www.gogojungle.co.jp/tools/indicators/11836
The PDF file includes 283 items.
Many of themexplain linking higher and lower timeframes logically using three RCI lines to examine multiple lower-timeframe situations sequentially, and ultimately arrive at the moment to buy on dips or sell on rallies in the lower timeframe (i.e., the mBDSR signal)as examples.
Also,there are many that emphasize identifying points where multiple entry justifications overlap.
The explanation usesmore than 1,000 charts in total.

× ![]()


