

AUD/JPY March 26, 2024
AUDJPY 5-minute chart
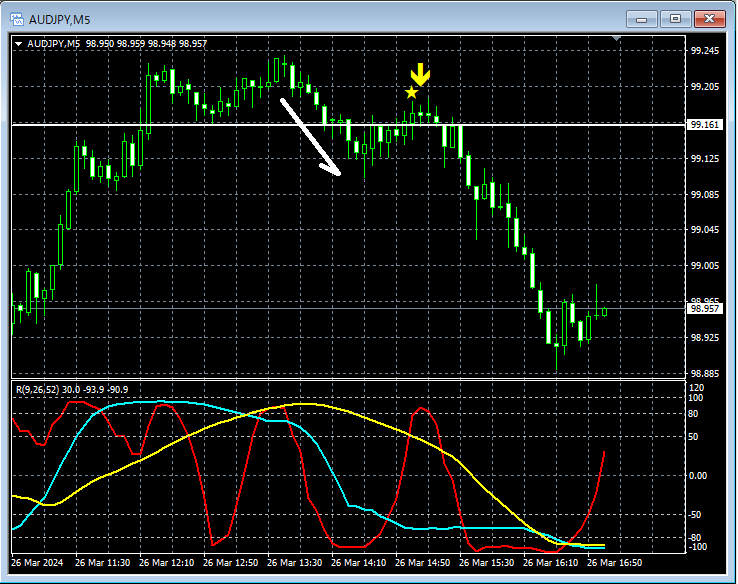
In the 5-minute chart above,pullback lowis broken to the downside and then risesmBDSR (RCI two-line filter) return-sell signallights up and the price moves lower.
From this example,a trading method focusing on the pullback low ( Dow Theory)andthe signals of mBDSRshow a high degree of compatibility.
An indicator that shines when combined with RCI: 【BODSOR・mBDSR】
and its method & case studies (PDF) ★GogoJungle AWARD 2020 winner★
https://www.gogojungle.co.jp/tools/indicators/11836
The PDF file includes 283 items.
Many of themdetail logical linking of higher and lower timeframes using three RCI lines, examining multiple lower-timeframe situations sequentially, and ultimately waiting for pullback buys or retracement sells (the mBDSR signal) on the lower timeframeas examples.
Additionally,many focus on capturing points where multiple entry justifications overlapas well.
The explanations usemore than 1,000 chartsin total.

× ![]()


