

Euro dollar 15-minute chart aiming for the 3rd wave!!
EURUSD 15-minute chart
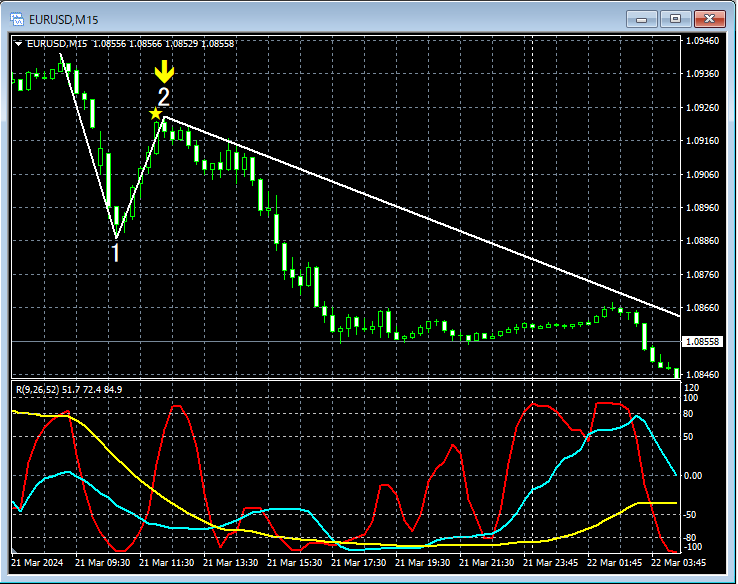
In the 15-minute chart above,the initial move of Wave 3isthe mBDSR (RCI two-line filter) sell signallights up and it declines.
From this example,the trading method targeting Wave 3andthe signal of mBDSRshow high compatibility.
An indicator that shines when combined with RCI: 【BODSOR・mBDSR】
and methods & case studies (PDF) ★GogoJungle AWARD2020 winner★
https://www.gogojungle.co.jp/tools/indicators/11836
The PDF file comes with 283 items.
Most of them are examples that have been distilled into a form where multiple lower-timeframe conditions are examined logically by linking the higher and lower timeframes using three RCI lines, finally waiting for a timing to buy on dips or sell on rallies in the lower timeframe (i.e., the mBDSR signal).They also focus on capturing points where multiple entry criteria align.
In the explanations,
over 1,000 chartsare used.

× ![]()


