

Dollar/Yen 5-minute chart aiming for the third wave!!
Dollar/Yen 5-minute chart
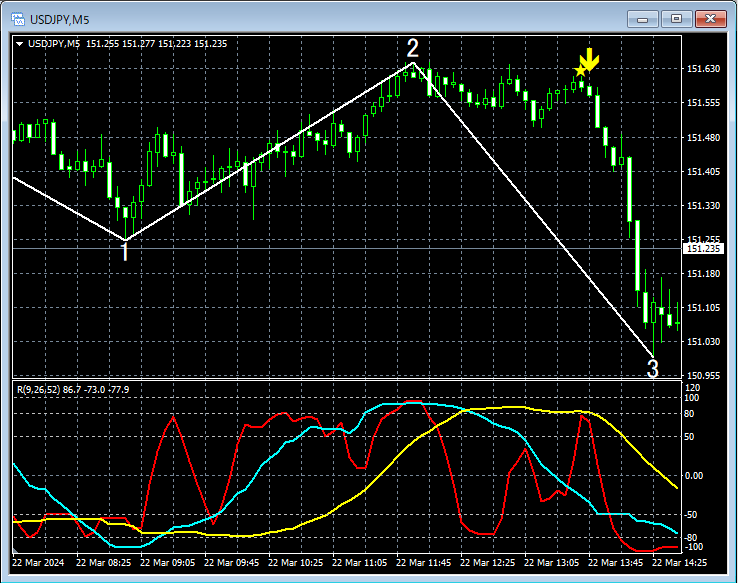
In the 5-minute chart above,the initial move of the 3rd waveismBDSR (RCI two-filter) overbought signallights up and it is moving down.
From this example,the trading method aiming at the 3rd waveandthe mBDSR signalappear to be highly compatible.
Indicators that excel when combined with RCI【BODSOR・mBDSR】
and the method & case studies (PDF) ★GogoJungle AWARD2020 winner★
https://www.gogojungle.co.jp/tools/indicators/11836
The PDF file comes with 283 items.
Many of them describe examples that break down into waiting for a timing of a pullback or a bounce on the lower time frame by logically linking the higher and lower timeframes using three RCI lines, ultimately waiting for the timing of a pullback buy or return sell on the lower time frame (i.e., the mBDSR signal).
Also,many focus on capturing points where multiple entry reasons overlap..
The explanations useover 1,000 charts in total..

× ![]()


