

Dollar/Yen March 20, 2024
USD/JPY 1-minute chart
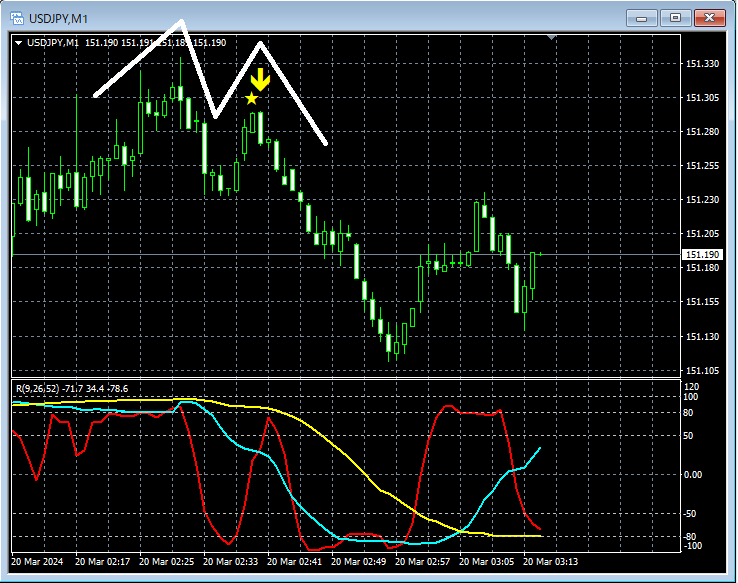
In the 1-minute chart above,Double topis forming and moving lower.Double topOn the right peak,the mbDSR (RCI 2-band filter) reversal selling signallights up.
From this example,a trading method that focuses on the double topandthe signal of mbDSRshow strong compatibility.
Indicator that shines in combination with RCI: BODSOR・mbDSR
and Method & Case Studies (PDF) ★GogoJungle AWARD 2020 winner★
https://www.gogojungle.co.jp/tools/indicators/11836
The PDF file includes 283 items.
Many of them are examples that lay out a process of using three RCI lines to logically link higher and lower timeframes, sequentially considering the conditions of multiple lower timeframes, and ultimately waiting for a timing to buy on dips or sell on rallies in the lower timeframes (i.e., mbDSR signals).Additionally,
many focus on identifying points where multiple entry reasons overlap..
The explanations useover 1,000 charts in total..

× ![]()


