

AUDJPY March 18, 2024
Australian Dollar/Yen 1-Hour Chart
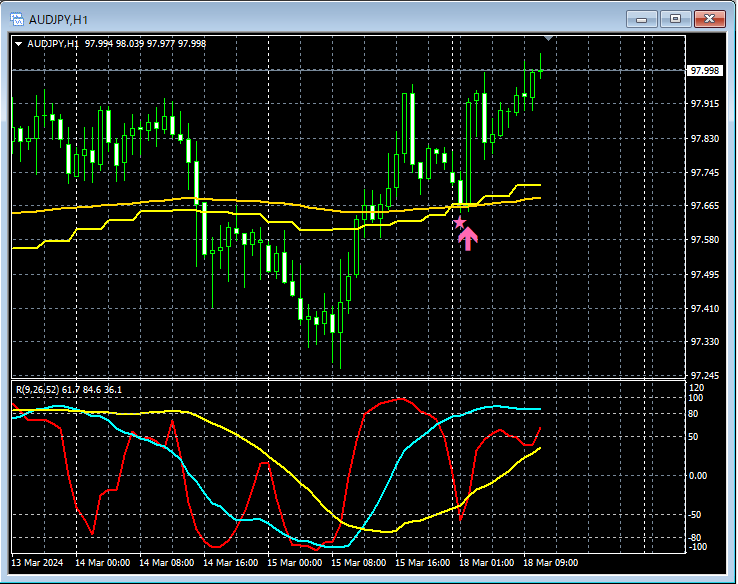
In the 1-hour chart above,4-hour EMA21 and 1-hour EMA200overlap around this pointmBDSR (RCI2-filter) pullback buying signallights up and rises.
From this example,a trading method focusing on moving averagesandthe signal from mBDSRshow a high degree of compatibility.
Indicator that shines when combined with RCI【BODSOR・mBDSR】
and method/case studies (PDF) ★GogoJungle AWARD2020 winner★
https://www.gogojungle.co.jp/tools/indicators/11836
The PDF file includes 283 items.
Many of them are about logically linking higher and lower timeframes using three RCI lines, examining the multiple lower timeframes in sequence, and ultimately waiting for pullbacks (or pullbacks) timing on the lower timeframe (i.e., mBDSR signal).This is summarized as an example.
Additionally,there are many that emphasize identifying points where multiple entry reasons coincide..
The explanations usemore than 1,000 charts in total.

× ![]()


