

Gold XAUUSD From the latest chart March 15, 2024
GOLD XAUUSD 30-minute chart
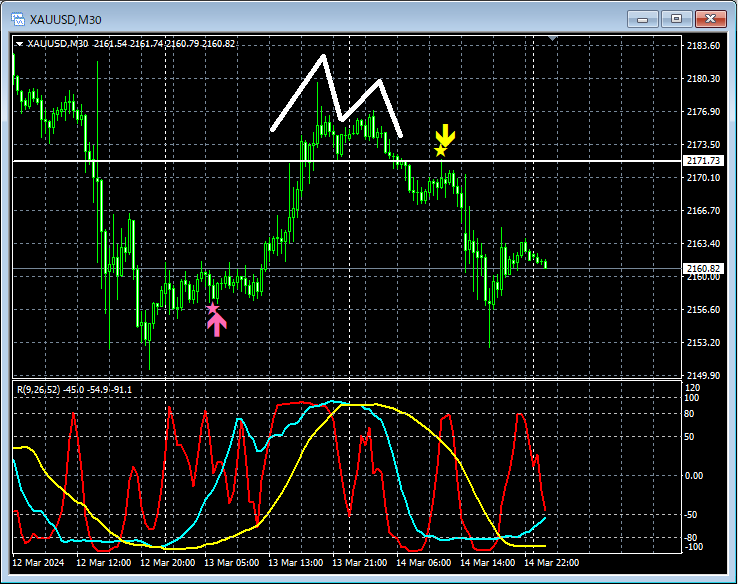
In the 30-minute chart above,mBDSR (RCI 2-line filter) bullish breakout signal and pullback sell signallight up once each.Pullback sell signalis a pattern that lights up when it returns near theneckline of the Double Topand then lights up.
From this example,a trading method focused on the Double Top necklineandthe signals of mBDSRshowing high compatibility.
Indicators that excel in combination with RCI【BODSOR・mBDSR】
and method/case studies (PDF) ★GogoJungle AWARD2020 winner★
https://www.gogojungle.co.jp/tools/indicators/11836
The PDF file includes 283 items.
Most of them are examples that logically link higher time frames and lower time frames using three RCI lines, systematically examining multiple lower-time-frame conditions, and ultimately waiting for pullback buys or pullback sells on the lower time frame (i.e., the mBDSR signal).
Additionally,many focus on capturing points where multiple entry reasons overlap..
The explanations usemore than 1,000 charts in total..

× ![]()


