

AUDNZD March 14, 2024
AUDNZD 15-minute chart
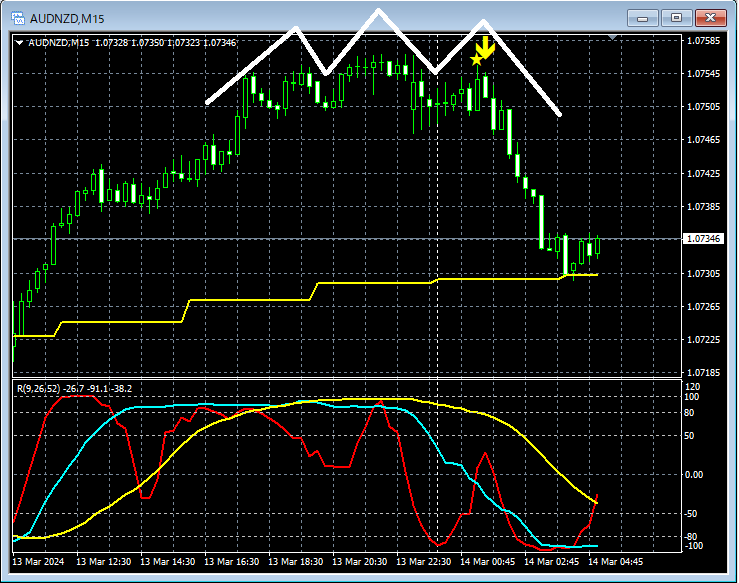
On the 15-minute chart above,Head and Shouldersis forming and declining.Head and Shoulderson the right shoulder,mBDSR (RCI two-filter) pullback sell signallights up as a pattern. Personally, I consider this important4-hour EMA21to be downward.
From this example,a trading method focused on the head and shouldersandthe signal of mBDSRshow a high level of compatibility.
Indicator [BODSOR・mBDSR] that shines in combination with RCI
and the method/case studies (PDF) ★GogoJungle AWARD 2020 Winner★
https://www.gogojungle.co.jp/tools/indicators/11836
The PDF file includes 283 items.
Many of them consist of cases that logically link higher and lower timeframes using three RCI lines, progressively examining multiple lower timeframes, and ultimately waiting for timing to buy on dips or sell on rallies in the lower timeframe (i.e., the mBDSR signal).
Also,there are many that emphasize identifying points where multiple entry reasons overlap..
For explanations,more than 1,000 chartsare used.

× ![]()


