

Pound-Yen March 13, 2024
Pound/Yen 1-minute chart
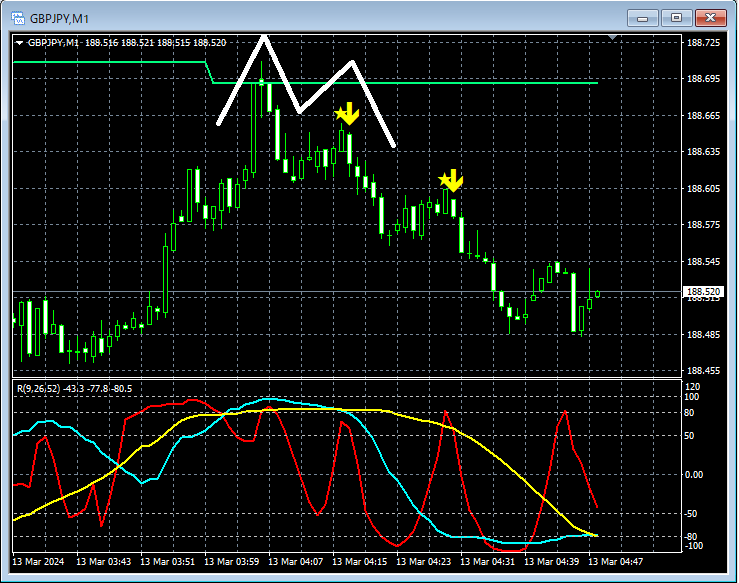
In the 1-minute chart above,1-hour EMA21aroundDouble topis formed and it declines.Double topon the right peak,mBDSR (RCI two-filter) overbought signallights up as a pattern. Even during the subsequent decline, the overbought signal remains lit.
From this example,a trading method focusing on moving averages and double topsandthe signal of mBDSRshow a high degree of harmony.
Indicator that shines when paired with RCI: 【BODSOR・mBDSR】
and the method & case study (PDF) ★GogoJungle AWARD2020 recipient★
https://www.gogojungle.co.jp/tools/indicators/11836
The PDF file comes with 283 items.
Many of them are summaries of examples that logically link higher and lower timeframes by using three RCI lines, sequentially considering the状況 of multiple lower timeframes, and ultimately waiting for timing to buy on dips or sell on rallies in the lower timeframe (i.e., mBDSR signals).They are also largely focused on capturing points where multiple entry factors coincide.
The explanations usemore than 1,000 charts in total..

× ![]()


