

Previous low of the upper leg, double bottom, and mBDSR (RCI two-band filter) pullback buy signal
Euro-AUD 5-minute chart
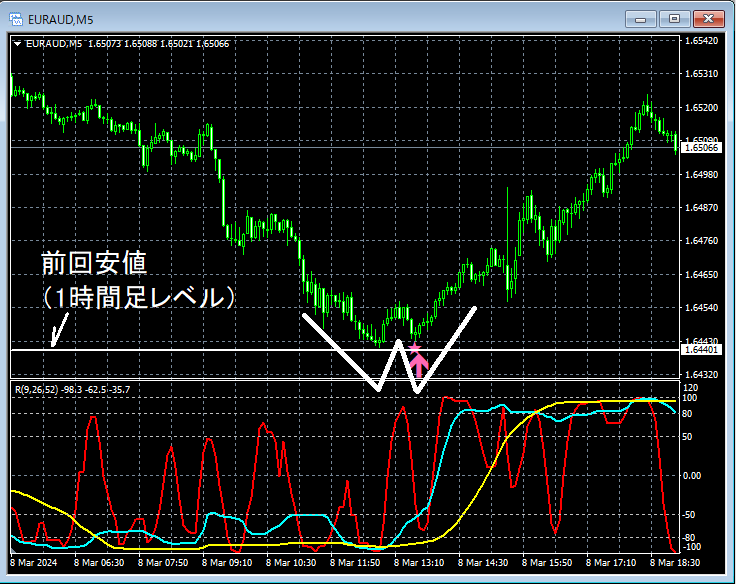
In the 5-minute chart above, at the hourly chart levelprevious lownear which price has droppeddouble bottomis formed and rising.double bottomon the right-side valleymBDSR (2 RCIs filters) pullback buying signallights up in this pattern.
From this example,a method focusing on the previous low and double bottom of the higher time frameandthe signal of mBDSRshow a high degree of compatibility.
An indicator that shines when paired with RCI: 【BODSOR・mBDSR】
and method/case study (PDF) ★GogoJungle AWARD 2020 winner★
https://www.gogojungle.co.jp/tools/indicators/11836
The PDF file includes 283 items.
Most of them are aboutusing three-line RCI to logically link higher and lower timeframes, sequentially considering multiple lower-timeframe conditions, and ultimately concluding with waiting for pullbacks in the lower timeframes (i.e., mBDSR signals) as the timing.This is the summarized content.
Additionally,many of them focus on identifying points where multiple entry reasons coincide.There are many such examples.
In the explanations,more than 1,000 chartsare used.

× ![]()


