

RCI 3-line main line, Elliott Wave, and mBDSR signals
Euro/AUD 15-minute chart
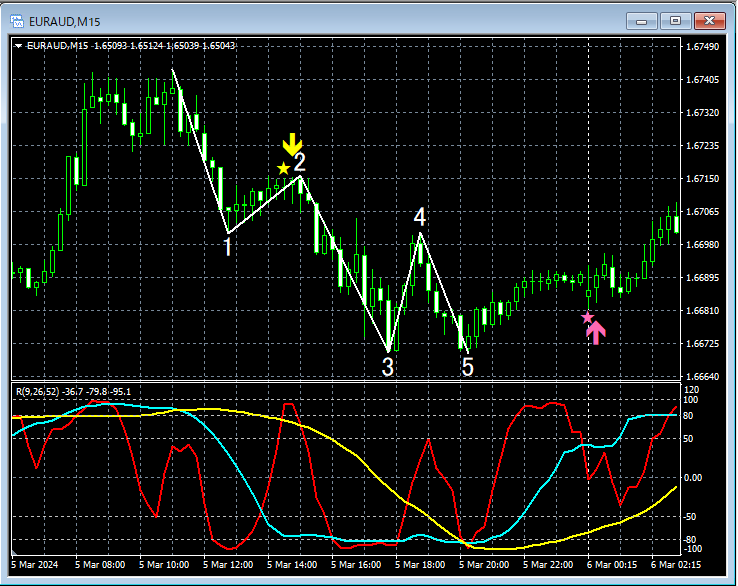
The 15-minute chart above shows theElliott Wave on the 5-minute chart.Downward Wave 3Just before its start, themBDSR (RCI two-filter) short signal lights up and the price moves down.
From this example,Elliott Wave andmBDSR signals show a high degree of compatibility.
Indicator that shines when paired with RCI:【BODSOR・mBDSR】
and the methods & case studies (PDF) ★GogoJungle AWARD2020 winner★
https://www.gogojungle.co.jp/tools/indicators/11836
The PDF package includes 283 files.
Many of them demonstrate examples that logically link higher-timeframe and lower-timeframe using three RCI lines, sequentially examining multiple lower timeframes, and ultimately waiting for a timing to buy on dips or sell on rallies on the lower timeframe (i.e., mBDSR signals)..
Additionally,many focus on identifying points where multiple entry reasons coincide..
The explanations useover 1,000 charts in total..

× ![]()


