

Dollar/Yen 1-minute chart from March 6, 2024
Dollar/Yen 1-minute chart
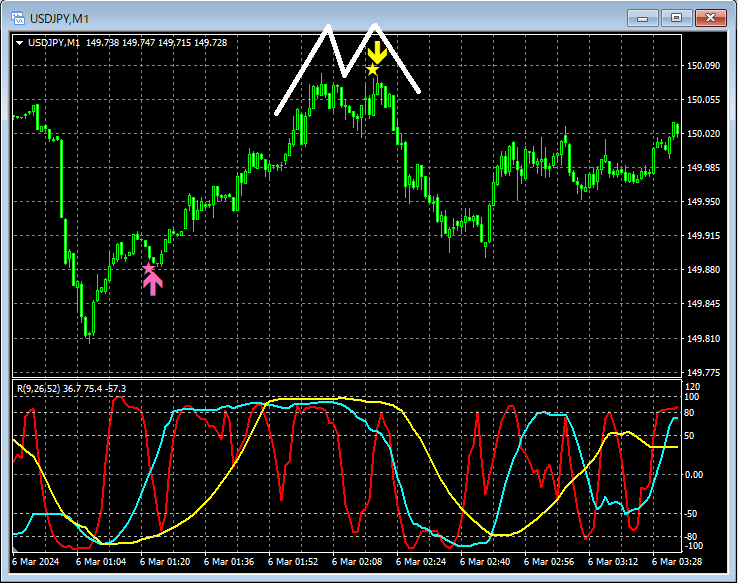
In the 1-minute chart above,Double topon the right peakmBDSR (RCI two-filter) pullback sell signallights up and price declines.
From this example,a trading method focusing on the double topandthe signal of mBDSRshow a high degree of compatibility.
Indicator that shows power when combined with RCI: 【BODSOR・mBDSR】
and method & case studies (PDF) ★GogoJungle AWARD2020 winner★
https://www.gogojungle.co.jp/tools/indicators/11836
The PDF file comes with 283 items.
Many of them describe logically linking higher and lower timeframes using three RCI lines to examine multiple lower timeframes sequentially, eventually detailing a setup that waits for a pullback buy or a pullback sell timing on the lower timeframe (i.e., an mBDSR signal).
Also,many focus on identifying points where multiple entry reasons overlap..
The explanation usesover 1,000 chartsin total.

× ![]()


