

Dollar/Yen February 29, 2024 (Thursday)
An indicator that demonstrates power when combined with RCI【BODSOR・mBDSR】
Methods and Case Studies (PDF) ★GogoJungle AWARD2020 Winner★
https://www.gogojungle.co.jp/tools/indicators/11836
The PDF file comes with 283 items.
Many of them are examples that lay out a form where you logically link higher and lower timeframes using three RCI lines, sequentially consider the conditions of multiple lower timeframes, and ultimately wait for a timing to buy on dips or sell on rallies on the lower timeframe (the mBDSR signal)..
Also,many focus on identifying points where multiple entry reasons overlap..
In explanations,more than 1,000 chartsare used.

In recent Investor Navi+ articles,we highlight examples that show the high compatibility between various trading methods and the mBDSR signal.
USD/JPY 1-hour
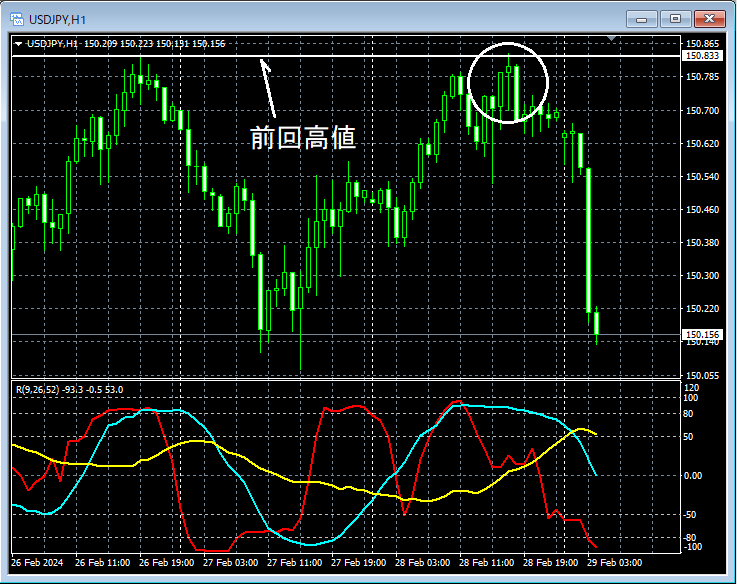
In the area circled with a white circle on the 1-hour chart above,the previous highis approached but the advance stalls. It might be reasonable to look for a pullback on the lower timeframes.
USD/JPY 15-minute
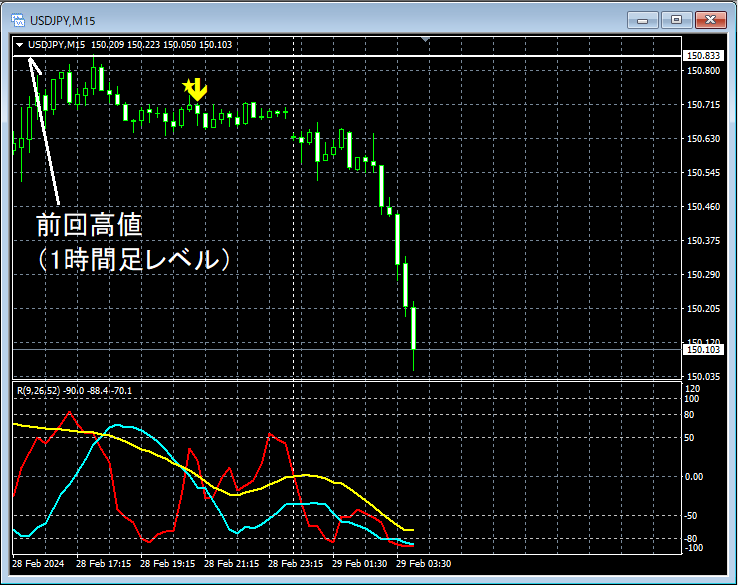
On the 15-minute chart above,the previous high (hourly level)is not cleanly broken to the upside and reverses.mBDSR (RCI two-filter) pullback sell signallights up and it goes down.
From this example,a trading method that focuses on the previous highandthe mBDSR signalshowing a strong synergy.
An indicator that shines when combined with RCI【BODSOR・mBDSR】
Methods and Case Studies (PDF) ★GogoJungle AWARD2020 Winner★
https://www.gogojungle.co.jp/tools/indicators/11836
The PDF file comes with 283 items.
Many of them are examples that lay out a form where you logically link higher and lower timeframes using three RCI lines, sequentially consider the conditions of multiple lower timeframes, and ultimately wait for a timing to buy on dips or sell on rallies on the lower timeframe (the mBDSR signal)..
Also,many focus on identifying points where multiple entry reasons overlap..
In explanations,more than 1,000 chartsare used.

× ![]()


