

Return high of the upper timeframe and mBDSR (RCI two-filter) return sell signal on the lower timeframe
Indicator that shines when combined with RCI: BODSOR・mBDSR
and methods & case studies (PDF) ★GogoJungle AWARD 2020 winner★
https://www.gogojungle.co.jp/tools/indicators/11836
The PDF file includes 283 attachments.
Many of them are cases that have been distilled into a form where, by using three RCI lines to logically link higher and lower timeframes, the situations of multiple lower timeframes are sequentially examined, and finally wait for the timing of buy the dip on the lower timeframes or sell the rally (the mBDSR signal).
Also,many focus on capturing points where multiple entry reasons overlap.
In the explanations,more than 1,000 chartsare used.

In recent Investor Navi+ articles,we present examples that show the high compatibility between various trading methods and the mBDSR signals.
EURJPY 15-minute chart
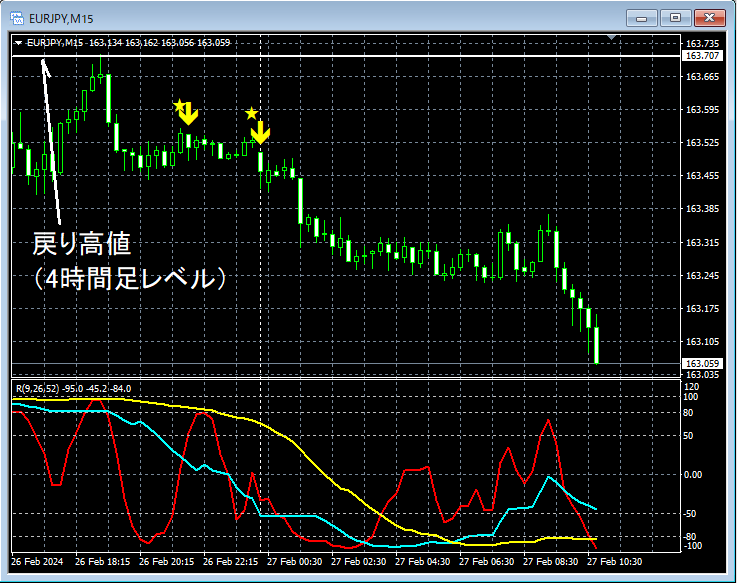
On the 15-minute chart above,the price could not break above the return high (4-hour level) and turned down. During the decline,the mBDSR (RCI two-filter) buy-the-dip signal lit up twice and it continued lower.
From this example,a trading method focused on the return high (Dow Theory) andthe mBDSR signals show a strong compatibility.
Indicator that shines when combined with RCI: BODSOR・mBDSR
and methods & case studies (PDF) ★GogoJungle AWARD2020 winner★
https://www.gogojungle.co.jp/tools/indicators/11836
The PDF file includes 283 attachments.
Many of them are cases that have been distilled into a form where, by using three RCI lines to logically link higher and lower timeframes, the situations of multiple lower timeframes are sequentially examined, and finally wait for the timing of buy the dip on the lower timeframes or sell the rally (the mBDSR signal).
Also,many focus on capturing points where multiple entry reasons overlap.
In the explanations,more than 1,000 chartsare used.

× ![]()


