

Movement of the dollar index after the U.S. employment statistics release
0
An indicator that demonstrates its power when combined with RCI【BODSOR・mBDSR】
and methodology / case studies (PDF) ★GogoJungle AWARD2020 Winner★
https://www.gogojungle.co.jp/tools/indicators/11836
283 PDF files are included.
Many of them are examples that, by using three RCI lines to logically link higher and lower timeframes, sequentially examine the conditions of multiple lower timeframes and ultimately wait for a timing to buy on dips or sell on rallies in the lower timeframe (the mBDSR signal)..
Also,many focus on identifying points where multiple entry reasons overlap.
In the explanations,more than 1,000 chartsare used.

Dollar Index 30-minute chart
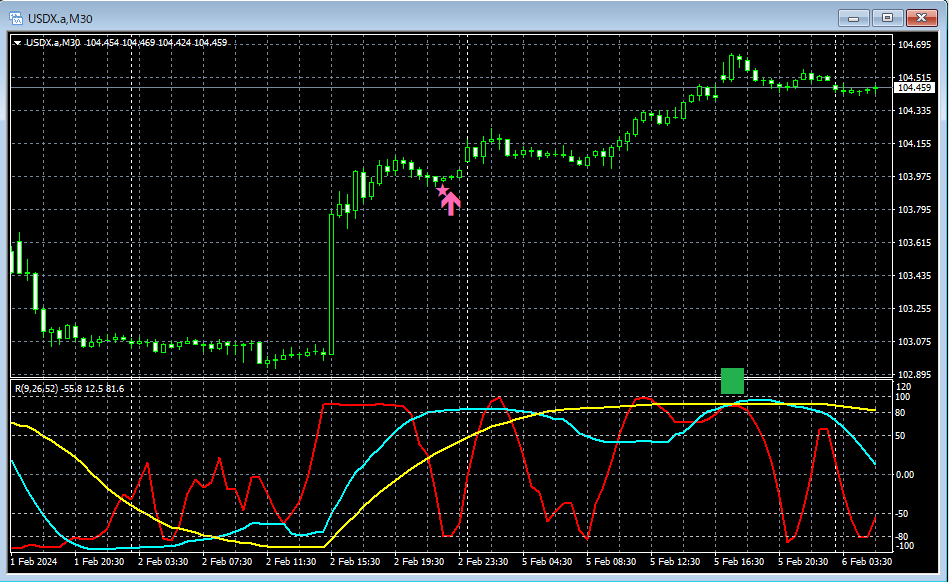
On the upper 30-minute chart, after the post-U.S. employment data surge,mBDSR (2 RCI filters) dip-buy signallights up and the price rises further. It has reached a shape known asRCI triple top(green square).
An indicator that demonstrates its power when combined with RCI【BODSOR・mBDSR】
and methodology / case studies (PDF) ★GogoJungle AWARD2020 Winner★
https://www.gogojungle.co.jp/tools/indicators/11836
283 PDF files are included.
Many of them are examples that, by using three RCI lines to logically link higher and lower timeframes, sequentially examine the conditions of multiple lower timeframes and ultimately wait for a timing to buy on dips or sell on rallies in the lower timeframe (the mBDSR signal).
Also,many focus on identifying points where multiple entry reasons overlap.
In the explanations,more than 1,000 chartsare used.

× ![]()


