

RCI3 main line and moving average line and supporting lows and mBDSR signals and Fibonacci expansions
Indicator that shines in combination with RCI: BODSOR and mBDSR
method・case studies (PDF) ★GogoJungle AWARD2020 winner★
https://www.gogojungle.co.jp/tools/indicators/11836
The PDF file is attached with 283 items.
Many of them are examples that have been distilled into a format where, by logically linking higher-timeframe and lower-timeframe using the 3-line RCI, the situations of multiple lower-timeframes are examined sequentially, and finally wait for the timing of a pullback buy or a pullback sell on the lower timeframe (the mBDSR signal)..
Also,many focus on points where multiple entry bases overlap.
In the explanations,more than 1,000 chartsare used.

In recent Investor Navi+ articles,we showcase examples that illustrate the high compatibility between various trading methods and mBDSR signals.
EURUSD Daily
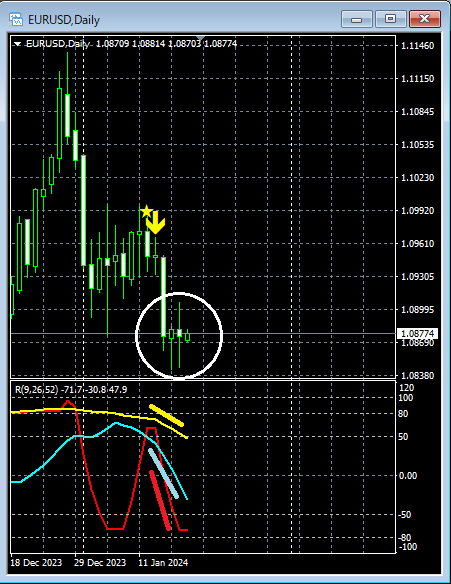
On the higher daily timeframe,the mBDSR pullback sell signallights up and the price declines.All three RCI lines decline, forming a very weak setup. It may also be reasonable to look for pullback selling on the lower timeframe.
EURUSD 15-minute
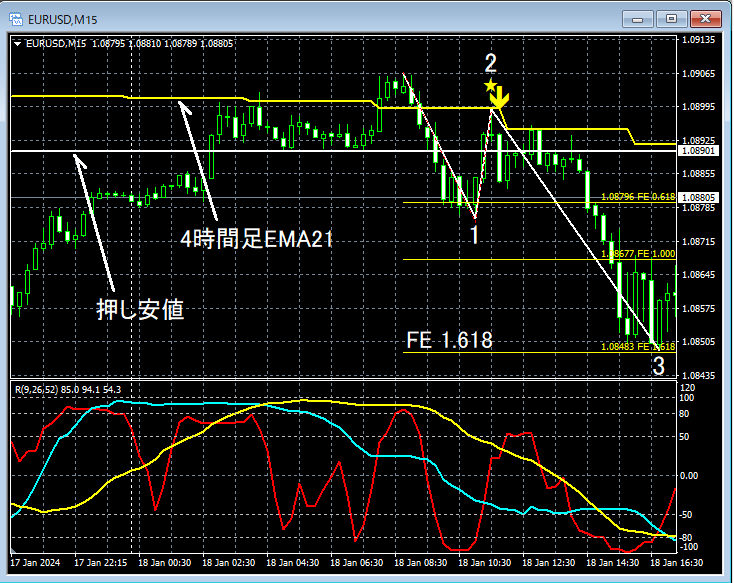
On the upper 15-minute chart,the 21-period EMA on the 4-hour timeframecannot be decisively broken above and reverses.A swing low is broken. On the subsequent retracementmBDSR (2-RCI filter) pullback sell signallights up and declines. In the end,Fibonacci expansiondrops toward around 1.618.
From this example,a high degree of compatibility between trading methods that focus on moving averages, swing lows (Dow Theory), and the RCI three-line setup, and themBDSR signalsis evident.
Indicator that shines in combination with RCI: BODSOR and mBDSR
method・case studies (PDF) ★GogoJungle AWARD2020 winner★
https://www.gogojungle.co.jp/tools/indicators/11836
The PDF file is attached with 283 items.
Many of them are examples that have been distilled into a format where, by logically linking higher-timeframe and lower-timeframe using the 3-line RCI, the situations of multiple lower-timeframes are examined sequentially, and finally wait for the timing of a pullback buy or a pullback sell on the lower timeframe (the mBDSR signal).
Also,many focus on points where multiple entry bases overlap.
In the explanations,more than 1,000 chartsare used.

× ![]()


