

RCI 3-line and Elliott Wave, Fibonacci Expansion, and mBDSR signals
Indicator that shines in combination with RCI【BODSOR・mBDSR】
Methods and case studies (PDF) ★GogoJungle AWARD 2020 winner★
https://www.gogojungle.co.jp/tools/indicators/11836
A PDF file with 283 attachments is included.
Many of them are examples that break down the process of logically linking the higher and lower timeframes using three RCI lines, sequentially examining the conditions of multiple lower timeframes, and eventually waiting for the timing to buy on dips or sell on rallies on the lower timeframe (i.e., the mBDSR signal).They are like that.
Also,many focus on catching points where multiple entry reasons overlapmany focus on catching points where multiple entry reasons overlap.
In the explanations,more than 1,000 chartsare used.

In a recent Invest Navi+ article,you can see the high compatibility between various trading methods and mBDSR signalsthrough mainly examples.
Gold XAUUSD 1-hour chart
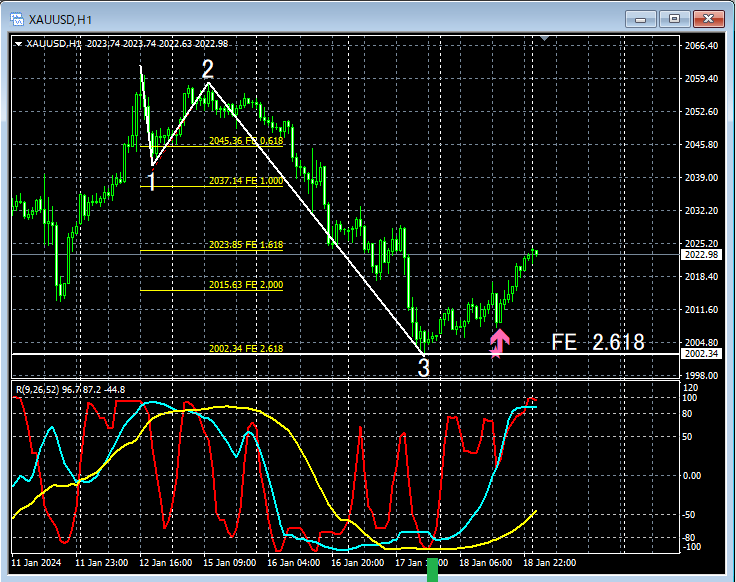
Looking at the 1-hour chart above,it has retraced to Fibonacci Expansion 2.618,the Elliott Wave decline's 第3 wavehas endedand may enter the 第4 wave of corrective. Also,the three-line RCIshows a continued decline to the so-calledRCI triple bottom (green box), suggesting a potential rise. By watching the chart,the mBDSR dip-buy signal (filter: RCI26 and RCI52) lights up, and price subsequently moves higher smoothly.
From this example,you can see the high compatibility between trades focusing on Elliott Wave, Fibonacci Expansions, and RCI three-lines andthe mBDSR signal.
Indicator that shines in combination with RCI【BODSOR・mBDSR】
Methods and case studies (PDF) ★GogoJungle AWARD 2020 winner★
https://www.gogojungle.co.jp/tools/indicators/11836
A PDF file with 283 attachments is included.
Many of them are examples that break down the process of logically linking the higher and lower timeframes using three RCI lines, sequentially examining the conditions of multiple lower timeframes, and eventually waiting for the timing to buy on dips or sell on rallies on the lower timeframe (i.e., the mBDSR signal).They are like that.
Also,many focus on catching points where multiple entry reasons overlap.
In the explanations,more than 1,000 chartsare used.

× ![]()


