

Sell signal on the pullback at the upper leg: previous high, double top, and mBDSR (RCI 2-filter) return signal
Indicator that shines in combination with RCI【BODSOR・mBDSR】
The method and case study (PDF) ★GogoJungle AWARD2020 winner★
https://www.gogojungle.co.jp/tools/indicators/11836
A total of 283 PDF files are included.
Many of them are examples that have been distilled into a form that links higher and lower timeframes logically using three RCI lines, and ultimately wait for a pullback buying or pullback selling timing on the lower timeframe (the mBDSR signal)..
In addition,many focus on capturing points where multiple entry triggers overlap..
In the explanations,more than 1,000 chartsare used.

In recent Investor Navi+ articles,examples showing the high compatibility between various trading methods and the mBDSR signalare introduced mainly.
NZDUSD 1-hour
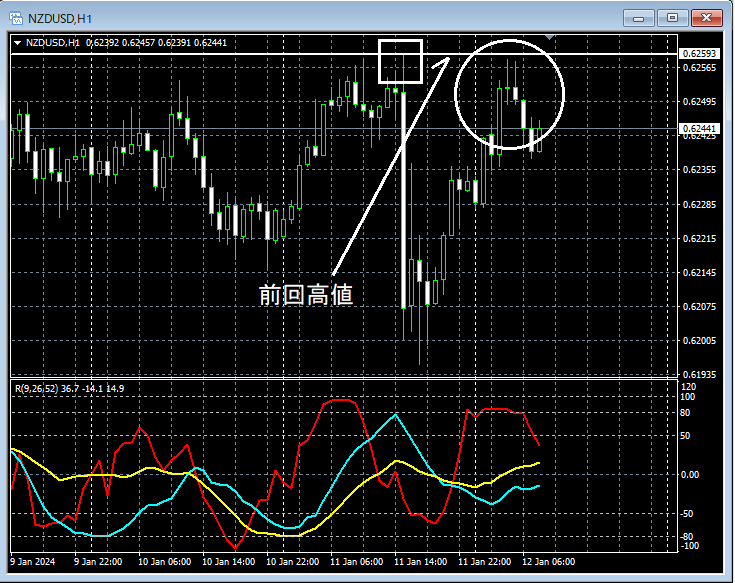
Around the area circled in white on the 1-hour chart above,the previous highhas risen nearby, and it might not be surprising if it dips a little for a moment.
NZDUSD 5-minute
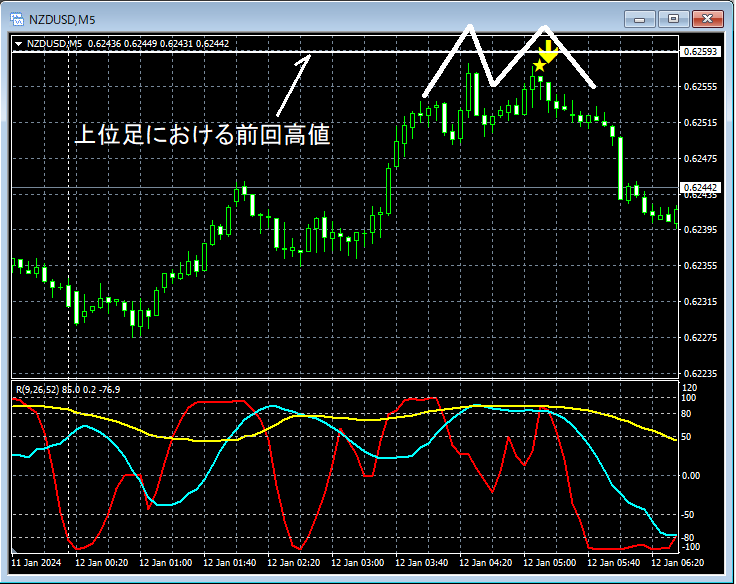
Looking at the 5-minute chart above,the previous high on the higher timeframerises near, thena double topon the right peakthe mBDSR (two RCI lines filter) pullback selling signallights up, and then price declines smoothly.
From this example,the high compatibility between a trading method that focuses on the previous high or double top on higher timeframesandthe mBDSR signalis evident.
Additionally, in this example,placing a stop-loss just above the recent highandachieving a high risk-reward tradeis possible.
Indicator that shines in combination with RCI【BODSOR・mBDSR】
The method and case study (PDF) ★GogoJungle AWARD2020 winner★
https://www.gogojungle.co.jp/tools/indicators/11836
A total of 283 PDF files are included.
Many of them are examples that have been distilled into a form that links higher and lower timeframes logically using three RCI lines, and ultimately wait for a pullback buying or pullback selling timing on the lower timeframe (the mBDSR signal)..
In addition,many focus on capturing points where multiple entry triggers overlap..
In the explanations,more than 1,000 chartsare used.
× ![]()


