

Return high of the higher leg, the neck line of the double top, and the return-sell signal of mbDSR (RCI two-filter).
0
Indicator that shines in combination with RCI【BODSOR・mBDSR】
and methodology/case studies (PDF) ★GogoJungle AWARD2020 winner★
https://www.gogojungle.co.jp/tools/indicators/11836
The PDF file includes 283 items.
Most of them are examples that break down the process of logically linking higher and lower timeframes using three RCI lines, sequentially considering the situations of multiple lower timeframes, and finally waiting for the lower timeframe’s timing to buy on dips or sell on rallies (i.e., the mBDSR signal). It is thus.
Also,many of them focus on capturing points where multiple entry reasons overlap.
In the explanations,over 1,000 chartsare used.

In recent Investor Navi+ articles,we present examples that demonstrate the high compatibility between various trading methods and the mBDSR signals.
GBPUSD 5-minute chart
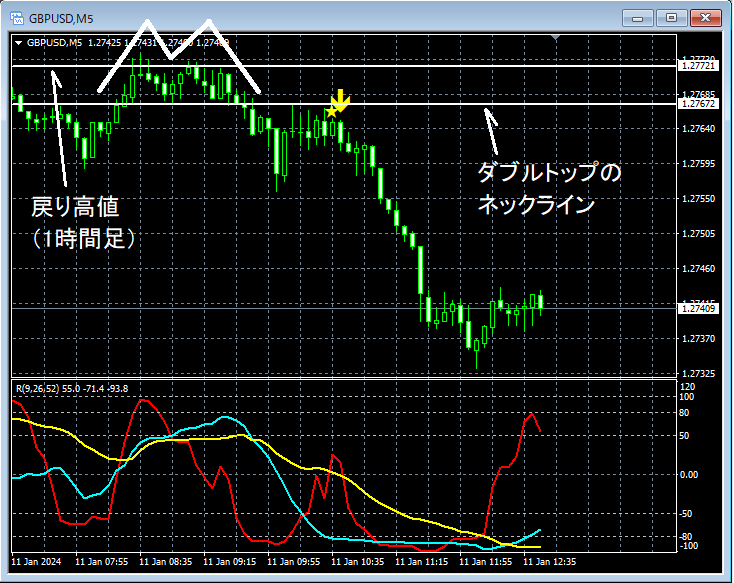
Looking at the 5-minute chart above, around the 1-hour chart’spullback high vicinitydouble top is formed and prices decline. Then, as it returns near thenecklinemBDSR (2 RCI filters) pullback sell signal, the lights up, and prices subsequently fall sharply.
From this example,a trading method focused on the double top neckline andthe mBDSR signal show a strong affinity.
Indicator that shines in combination with RCI【BODSOR・mBDSR】
and methodology/case studies (PDF) ★GogoJungle AWARD2020 winner★
https://www.gogojungle.co.jp/tools/indicators/11836
The PDF file includes 283 items.
Most of them are examples that break down the process of logically linking higher and lower timeframes using three RCI lines, sequentially considering the situations of multiple lower timeframes, and finally waiting for the lower timeframe’s timing to buy on dips or sell on rallies (i.e., the mBDSR signal). It is thus.
Also,many of them focus on capturing points where multiple entry reasons overlap.
In the explanations,over 1,000 chartsare used.

× ![]()


