

Double top neckline of the higher leg, double top of the lower leg, and the return-selling signal of mbRSR (RCI with two filters)
Indicator that shines when paired with RCI【BODSOR・mBDSR】
and methods/case studies (PDF) ★GogoJungle AWARD2020 winner★
https://www.gogojungle.co.jp/tools/indicators/11836
The PDF file includes 283 items.
Many of them are examples that have been distilled into a form where, by logically linking higher and lower timeframes using 3 RCI lines, the situations of multiple lower timeframes are examined sequentially, and finally wait for pullbacks in the lower timeframe or a timing to sell in a retracement (i.e., the mBDSR signal)..
In addition,there are many that emphasize identifying points where multiple entry rationale overlaps..
In the explanations,more than 1,000 chartsare used.

In recent Investor Navi+ articles,we showcase examples that illustrate the strong compatibility between various trading methods and the mBDSR signal.
Dollar/Yen 15-minute chart

If you look at the area circled by the white ellipse on the 15-minute chart above,it has retraced near the neck line of the double top, which isn’t unreasonable to consider selling on a retrace on the lower timeframe. Let’s look at that area on the 1-minute chart.
Dollar/Yen 1-minute chart
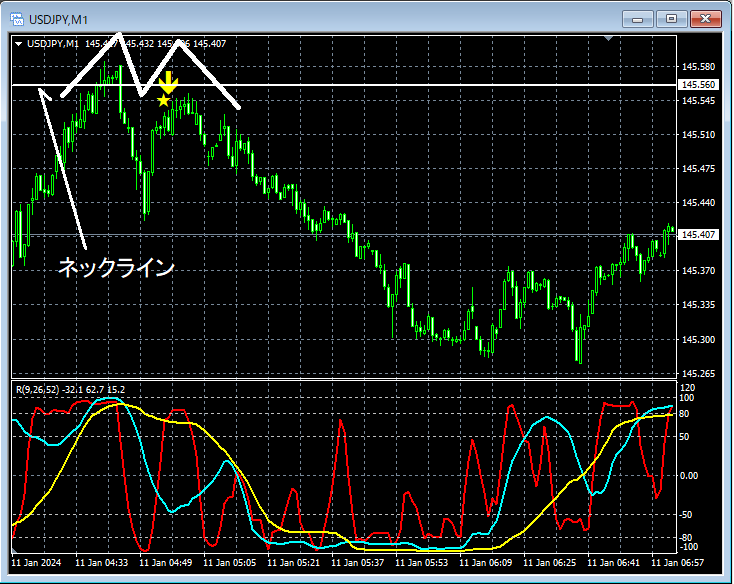
Looking at the 1-minute chart above, near the neck line of the double top on the 15-minute chart,neck line of the double top is forming. On the right peak of that double topdouble top,the mBDSR (two RCI filters) pullback/sell signal is lit up, and prices subsequently dropped sharply.
From this example,a trading method focused on the double top andthe mBDSR signal show a high degree of harmony.
Also, in this example,placing a stop loss slightly above the recent high,enables high risk-reward trades.
Indicator that shines when paired with RCI【BODSOR・mBDSR】
and methods/case studies (PDF) ★GogoJungle AWARD2020 winner★
https://www.gogojungle.co.jp/tools/indicators/11836
The PDF file includes 283 items.
Many of them are examples that have been distilled into a form where, by logically linking higher and lower timeframes using 3 RCI lines, the situations of multiple lower timeframes are examined sequentially, and finally wait for pullbacks in the lower timeframe or a timing to sell in a retracement (i.e., the mBDSR signal)..
In addition,there are many that emphasize identifying points where multiple entry rationale overlaps..
In the explanations,more than 1,000 chartsare used.

× ![]()


