

R-C-I three-line and Elliott Wave and mBDSR (RCI two-line filter) pullback buy signal
0
Indicator that demonstrates power when combined with RCI【BODSOR・mBDSR】
Methods and case studies (PDF) ★GogoJungle AWARD2020 winner★
https://www.gogojungle.co.jp/tools/indicators/11836
283 PDF files are included.
Many of them are examples that break down the process of logically linking higher and lower timeframes using 3-line RCI, sequentially examining the conditions of multiple lower timeframes, and ultimately waiting for a pullback buying or pullback selling timing in the lower timeframe (i.e., the mBDSR signal).They are thus arranged..
Also,many emphasize capturing points where multiple entry reasons coincide.
In the explanations,more than 1,000 chartsare used.

In recent Investment Navigator+ articles,we focus on examples that illustrate the high compatibility between various trading methods and mBDSR signals.
AUDUSD Daily
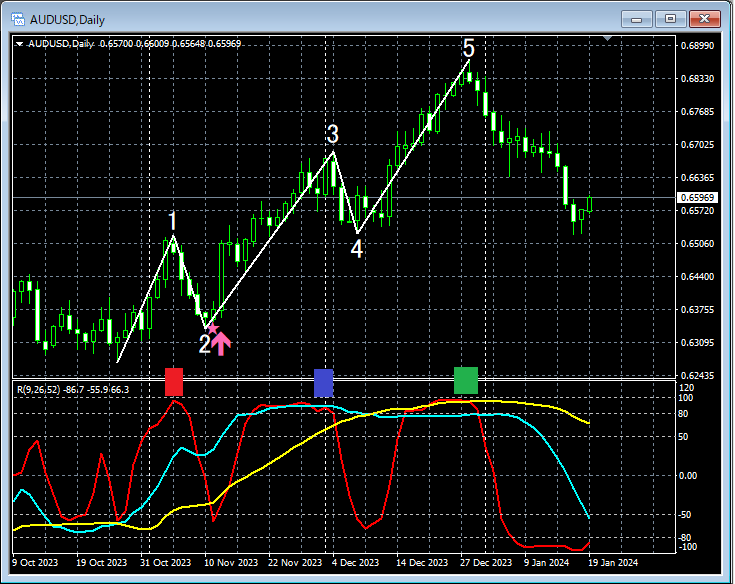
On the daily chart above, the lower-timeframe 4-hour Elliott Waveis displayed.
4-hour chartFirst rising wave: DailyRCI9 in the peak zonerises to (red box).
4-hour chartThird rising wave: DailyRCI2 double toprises to (blue box).
4-hour chartFifth rising wave: DailyRCI3 triple toprises to (or near) a green box.
Third rising waveshortly after the start,mBDSR (two RCI filters) pullback buying signallights up.
From this example,a trading method focusing ontheElliott Waveandtrades leveraging the RCI3-linemBDSR signalsandshows strong compatibility.
Indicator that demonstrates power when combined with RCI【BODSOR・mBDSR】
Methods and case studies (PDF) ★GogoJungle AWARD2020 winner★
https://www.gogojungle.co.jp/tools/indicators/11836
283 PDF files are included.
Many of them are examples that break down the process of logically linking higher and lower timeframes using 3-line RCI, sequentially examining the conditions of multiple lower timeframes, and ultimately waiting for a pullback buying or pullback selling timing in the lower timeframe (i.e., the mBDSR signal)..
Also,many emphasize capturing points where multiple entry reasons coincide.
In the explanations,more than 1,000 chartsare used.

× ![]()


