

Moving Average and R1R2S2 Pullback Buy Signal
Indicator that shines in combination with RCI【BODSOR・mBDSR】
and methods & case studies (PDF) ★GogoJungle AWARD2020 Winner★
https://www.gogojungle.co.jp/tools/indicators/11836
The PDF file includes 283 items.
Many of them are examples that lay out a process where multiple lower timeframes are logically linked with higher timeframes using three RCI lines, ultimately waiting for a buy-the-dottom or pullback sell timing on the lower timeframe (i.e., the mBDSR signal). and
are also included.
In the explanations,more than 1,000 chartsare used.

※【R1R2S2】is included in the above product.
※【R1R2S2】detailed explanation ishere.
USD/JPY 15-minute chart
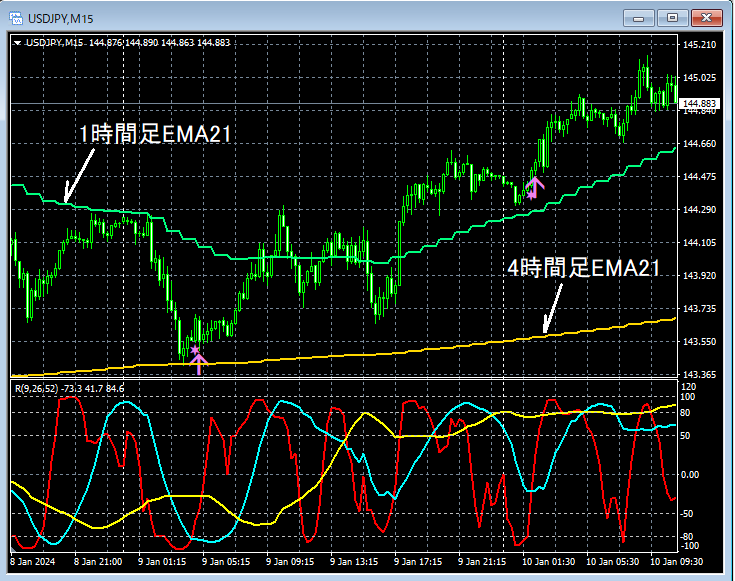
On the 15-minute chart above,the 4-hour EMA21acts as a support for rising timing, andacts as a support for rising timing,the 1-hour EMA21the R1R2S2 pullback buy signalis lit up.
From this example,a trading method focusing on moving averagesandthe R1R2S2 signalshow a high degree of harmony.
Indicator that shines in combination with RCI【BODSOR・mBDSR】
and methods & case studies (PDF) ★GogoJungle AWARD2020 Winner★
https://www.gogojungle.co.jp/tools/indicators/11836
The PDF file includes 283 items.
Many of them are examples that lay out a process where multiple lower timeframes are logically linked with higher timeframes using three RCI lines, ultimately waiting for a buy-the-dottom or pullback sell timing on the lower timeframe (i.e., the mBDSR signal).andfocus on capturing points where multiple entry bases overlap
are also included.In the explanations,
are used.

× ![]()


