

Double Bottom, Return Move, and mBDSR (RCI2 two-filter) Buy Signal
Indicator that shines in combination with RCI: 【BODSOR・mBDSR】
and method / case studies (PDF) ★GogoJungle AWARD 2020 Winner★
https://www.gogojungle.co.jp/tools/indicators/11836
283 PDF files are included.
Most of them are examples that have been translated into a form that waits for the timing of buying on dips or selling on rallies on the lower timeframe, by using three RCI lines to logically link the higher and lower timeframes and sequentially consider the situations of multiple lower timeframes (i.e., the mBDSR signal)..
Also,many focus on capturing points where multiple entry reasons overlap.
In the explanations,more than 1,000 chartsare used.

In recent Investor Navi+ articles,we mainly introduce examples that show the high compatibility between various trading methods and the mBDSR signals..
EURJPY 1-hour chart
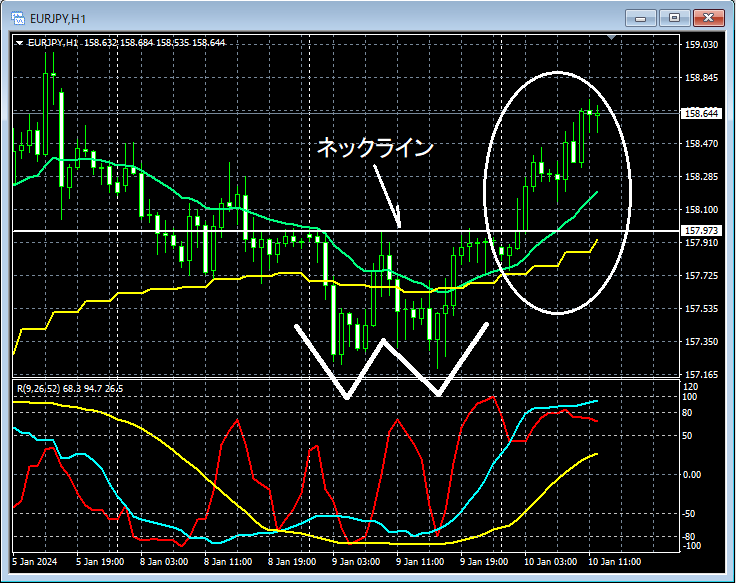
If you look at the area circled by the white ellipse on the 1-hour chart above,the neck line of the double bottomhas been surpassed, so it might not be unusual to consider buying on dips on the lower timeframe.
EURJPY 5-minute chart
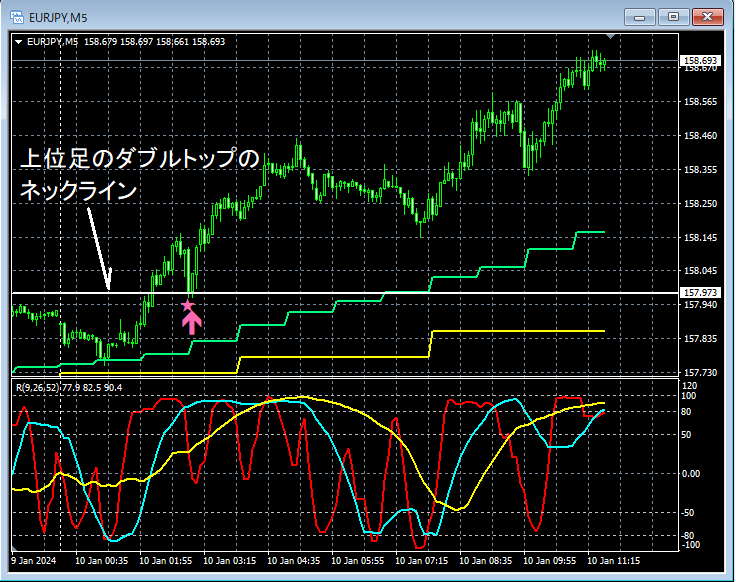
On the 5-minute chart above,a return movedrops toward the neck line of the upper timeframe'sdouble bottomandmBDSR (filters: RCI26 and RCI52) dip-buy signallights up, and afterward, the price rises.
From this example,the high harmony between a trade method that focuses on the neck line of the double bottom and return movesandthe mBDSR signalsis evident.
Indicator that shines in combination with RCI: 【BODSOR・mBDSR】
and method / case studies (PDF) ★GogoJungle AWARD 2020 Winner★
https://www.gogojungle.co.jp/tools/indicators/11836
283 PDF files are included.
Most of them are examples that have been translated into a form that links the higher and lower timeframes logically using three RCI lines, and ultimately consider the situations of multiple lower timeframes and wait for the timing to buy on dips or sell on rallies on the lower timeframe (=mBDSR signals).Also,
many focus on capturing points where multiple entry reasons overlap.
In the explanations,more than 1,000 chartsare used.

× ![]()


