

From yesterday's EUR/USD chart ~ signals of the 5-minute Elliott Wave and the 15-minute mBDSR (RCI two-filter) ~
0
Indicator that shines when paired with RCI [BODSOR・mBDSR]
Method and Case Studies (PDF) ★GogoJungle AWARD 2020 Winner★
https://www.gogojungle.co.jp/tools/indicators/11836
A PDF file containing 283 items is included.
Most of them are examples that break down how to logically link higher and lower timeframes using 3 RCI lines, sequentially examine the situations of multiple lower timeframes, and ultimately wait for pullback buying or pullback selling timing (the mBDSR signal) on the lower timeframe..
Also,there are many that emphasize capturing points where multiple entry signals overlap..
In the explanations,more than 1,000 chartsare used.

In recent Investment Navigator+ articles,we mainly introduce examples that show the high compatibility between various trading methods and the mBDSR signals..
EUR/USD 15-minute chart
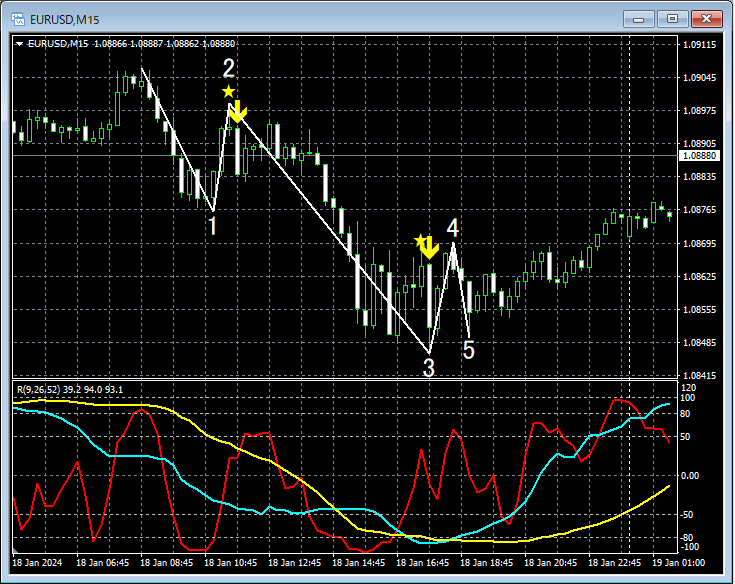
On the upper 15-minute chart, the lower-timeframe 5-minute Elliott Wave is displayed.Wave 3 of the downtrendis shown inside.mBDSR (2 RCI filters) sell signallights up at the timing twice.
From this example,the high compatibility betweentheElliott WavemBDSR signalsandis evident.
Indicator that shines when paired with RCI【BODSOR・mBDSR】
Method and Case Studies (PDF) ★GogoJungle AWARD 2020 Winner★
https://www.gogojungle.co.jp/tools/indicators/11836
A PDF file containing 283 items is included.
Most of them are examples that break down how to logically link higher and lower timeframes using 3 RCI lines, sequentially examine the situations of multiple lower timeframes, and ultimately wait for pullback buying or pullback selling timing (the mBDSR signal) on the lower timeframe..
Also,there are many that emphasize capturing points where multiple entry signals overlap..
In the explanations,more than 1,000 chartsare used.
× ![]()


