

Dollar-Yen: Buy-the-dip signal from the upward trendline and moving averages on higher timeframes, with mBDSR (RCI two-line filter)
0
Indicator that shines when combined with RCI【BODSOR・mBDSR】
and methods / case studies (PDF) ★GogoJungle AWARD2020 winner★
https://www.gogojungle.co.jp/tools/indicators/11836
The PDF file comes with 283 items.
Most of them are items that have been summarized to illustrate an example where, by logically linking the higher and lower timeframes using 3 RCI lines, the conditions of multiple lower timeframes are examined sequentially, and finally wait for a timing to buy on dips or sell on rallies in the lower timeframe (i.e., the mBDSR signal)..
Also,many focus on capturing points where multiple entry reasons overlap.There are many of those as well.
In the explanations,more than 1,000 chartsare used.

In recent Investor Navi+ articles,we mainly introduce examples that show the high compatibility between various trading methods and mBDSR signals.
USD/JPY 4-hour
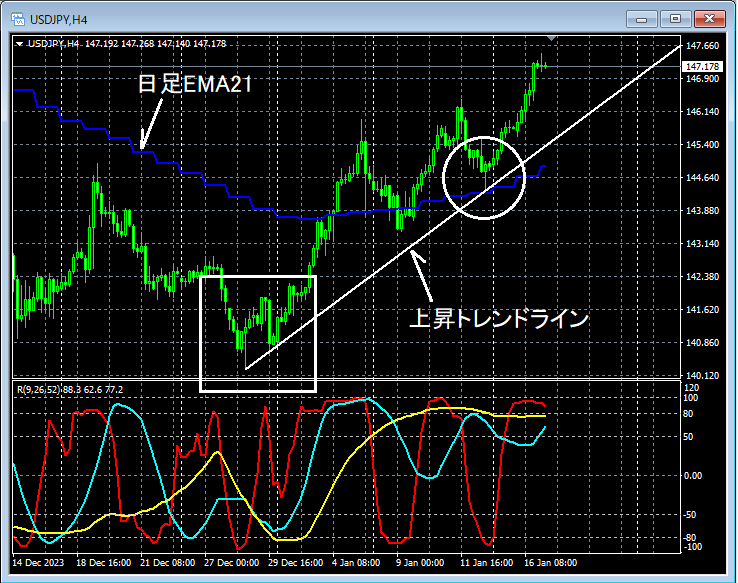
If you look at the area circled in white on the 4-hour chart above,the upward trend lineandthe daily EMA21overlap, which might be a reasonable time to consider buying on dips in the lower timeframe.
USD/JPY 5-minute
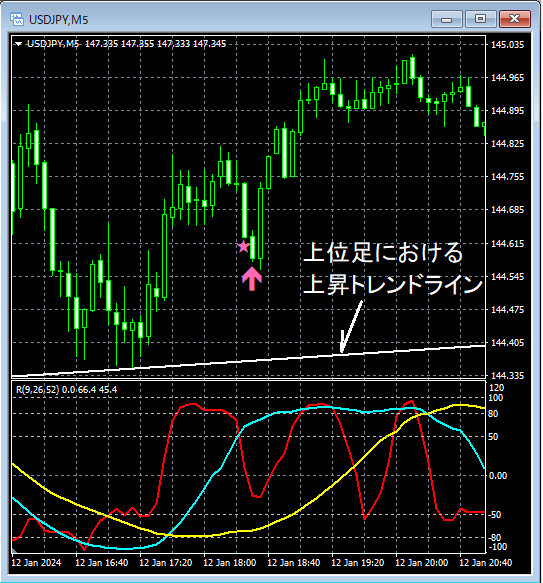
On the upper 5-minute chart,the upward trend line of the higher timeframeis nearby and rebounds. Then,mBDSR (filters: RCI26 and RCI52) dip-buy signallights up, and subsequently, the price rises smoothly.
From this example,the high compatibility between a trading approach focused on the higher timeframe's trendlines and moving averagesandthe mBDSR signalis evident.
Indicator that shines when combined with RCI【BODSOR・mBDSR】
and methods / case studies (PDF) ★GogoJungle AWARD2020 winner★
https://www.gogojungle.co.jp/tools/indicators/11836
The PDF file comes with 283 items.
Most of them are items that have been summarized to illustrate an example where, by logically linking the higher and lower timeframes using 3 RCI lines, the conditions of multiple lower timeframes are examined sequentially, and finally wait for a timing to buy on dips or sell on rallies in the lower timeframe (i.e., the mBDSR signal).Also,
many focus on capturing points where multiple entry reasons overlap.There are many of those as well.
In the explanations,more than 1,000 chartsare used.

× ![]()


