

Sell signal from the mBDSR (RCI2 band-pass filter) and the line connecting the neckline of the double top and the highs, and Fibonacci retracement
Indicator that shines in combination with RCI: 【BODSOR・mBDSR】
and methods and case studies (PDF) ★GogoJungle AWARD2020 winner★
https://www.gogojungle.co.jp/tools/indicators/11836
A total of 283 PDF files are included.
Many of them are examples that have been distilled into a form that logically links higher and lower timeframes using three RCI lines, sequentially examining the conditions of multiple lower timeframes, and finally waiting for timing of a pullback buying or pullback selling on the lower timeframe (i.e., the mBDSR signal)..
Also,many focus on capturing points where multiple entry reasons overlap..
In the explanations,more than 1,000 chartsare used.

In recent Investor Navi+ articles,we mainly showcase examples demonstrating the high compatibility between various trading methods and the mBDSR signals..
GBPUSD 15-minute chart
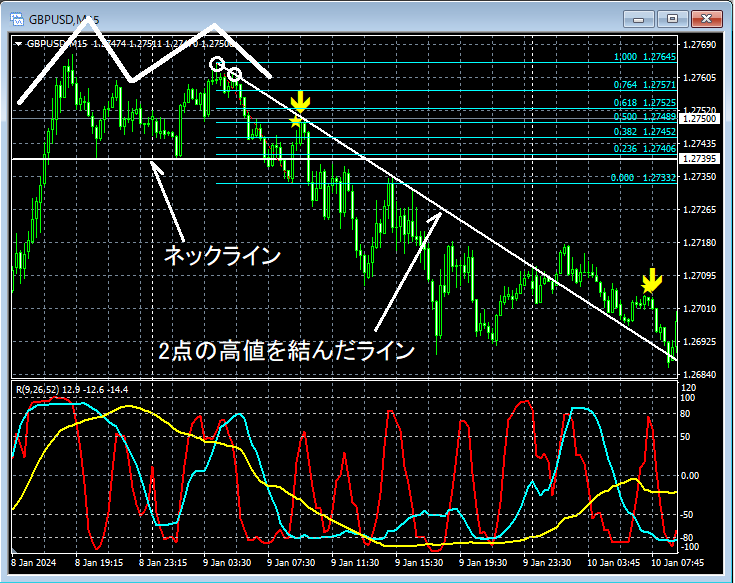
The higher timeframe conditions are omitted.
On the 15-minute chart above, firstthe neck line of the double topis broken. Then,the Fibonacci retracement 50.0% pullbackandthe line connecting two highsoverlapped near the areamBDSR (RCI two-filter) pullback selling signallights up and the price moves down.
From this example,the trade method focusing on the double top, Fibonacci retracement, and the line connecting highsandthe mBDSR signalshow a strong compatibility.
Indicator that shines in combination with RCI: 【BODSOR・mBDSR】
and methods and case studies (PDF) ★GogoJungle AWARD2020 winner★
https://www.gogojungle.co.jp/tools/indicators/11836
A total of 283 PDF files are included.
Many of them are examples that have been distilled into a form that logically links higher and lower timeframes using three RCI lines, sequentially examining the conditions of multiple lower timeframes, and finally waiting for timing of a pullback buying or pullback selling on the lower timeframe (i.e., the mBDSR signal)..
Also,many focus on capturing points where multiple entry reasons overlap..
In the explanations,more than 1,000 chartsare used.

× ![]()


