

Return High (Dow Theory) and Double Top and mBDSR (RCI double-filter) Sell Signal
An indicator that delivers power when combined with RCI【BODSOR・mBDSR】
Methods and Case Studies (PDF) ★GogoJungle AWARD2020 Winner★
https://www.gogojungle.co.jp/tools/indicators/11836
The PDF file includes 283 items.
Many of them describe examples that logically link higher and lower timeframes using three RCI lines, and ultimately wait for buy-the-dottom or pullback sell signals on the lower timeframe (i.e., mBDSR signals).They are organized this way.
Additionally,many focus on catching points where multiple entry reasons align.There are many such cases.
In the explanations,more than 1,000 chart imagesare used.

In recent Investor Navi+ articles,we showcase examples that illustrate the high compatibility between various trading techniques and mBDSR signals.
USD/JPY 15-minute chart
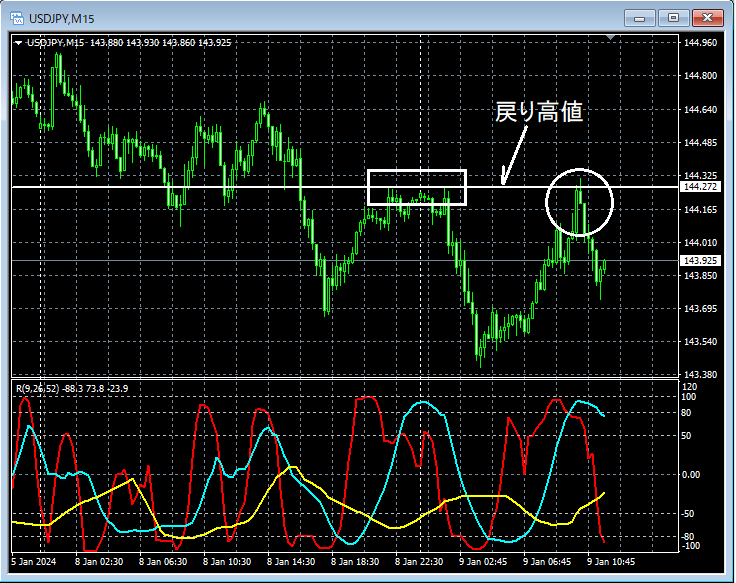
If you look at the area surrounded by a white circle on the higher timeframe,it rises toward the retracement higharound that level. It isn’t unlikely that a slight pullback could occur.
USD/JPY 1-minute chart
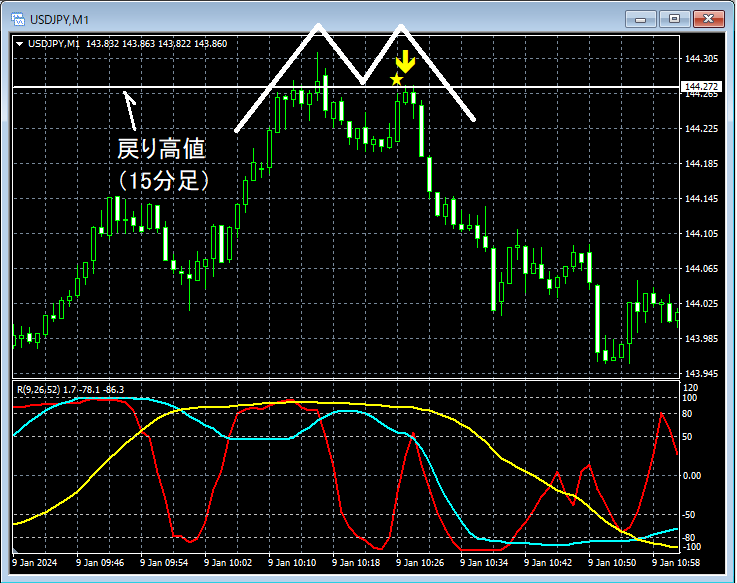
On the 1-minute chart above,the line indicating the retracement high of the higher timeframeis not decisively broken and then reverses.
As a result,the right shoulder of a double topandthe mBDSR pullback sell signallight up and the price moves down.
From this example,a trading method focused on retracement highs (Dow Theory) and double topsandthe signal of mBDSRshow a strong compatibility.
Also, in this example,placing a stop-loss slightly above the recent highdemonstrateshigh risk-reward tradesare possible.
An indicator that delivers power when combined with RCI【BODSOR・mBDSR】
Methods and Case Studies (PDF) ★GogoJungle AWARD2020 Winner★
https://www.gogojungle.co.jp/tools/indicators/11836
The PDF file includes 283 items.
Many of them describe examples that logically link higher and lower timeframes using three RCI lines, and ultimately wait for buy-the-dottom or pullback sell signals on the lower timeframe (i.e., mBDSR signals).They are organized this way.
Additionally,many focus on catching points where multiple entry reasons align.There are many such cases.
In the explanations,more than 1,000 chart imagesare used.

× ![]()


